Output Description

Virtual Twins

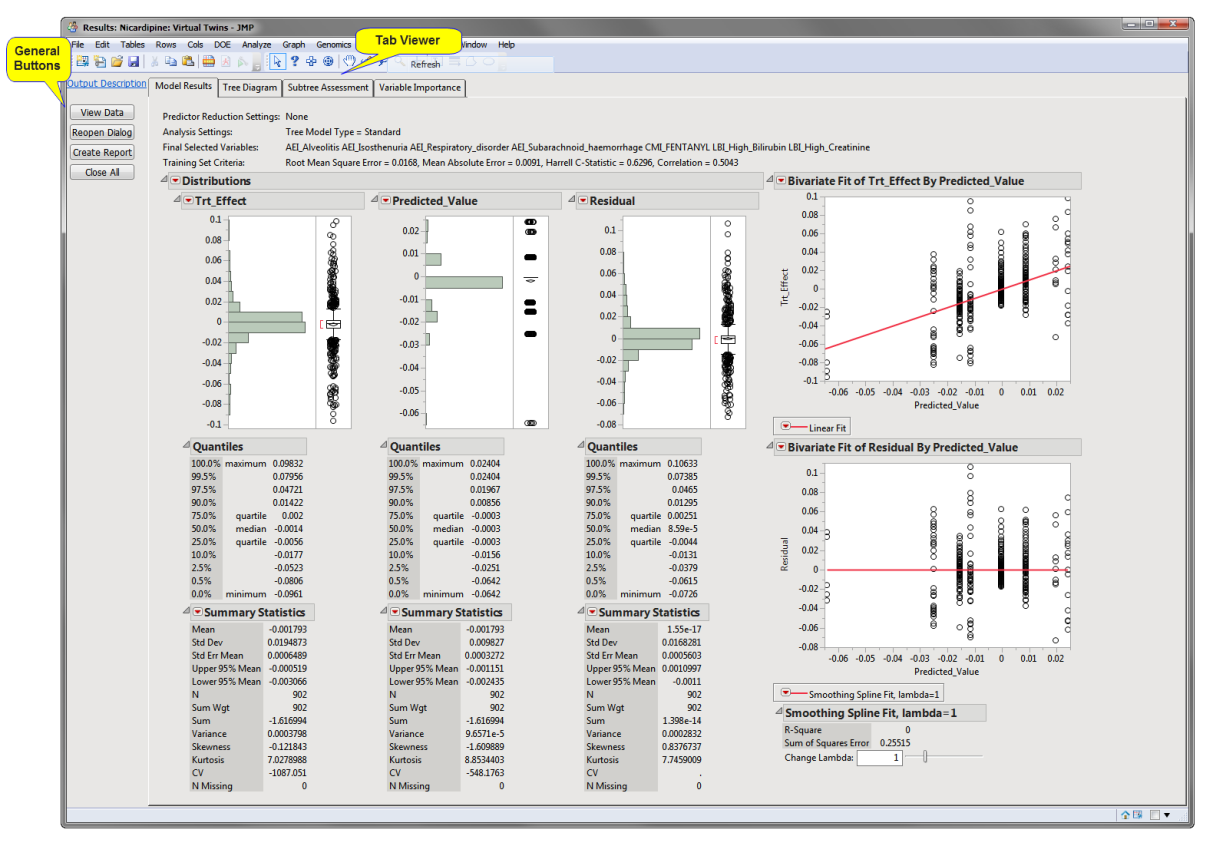
Running this process using the Nicardipine _patient_died sample setting generates the tabbed Results window shown below. Refer to the Virtual Twins process description for more information. Output from the process is organized into tabs. Each tab contains one or more plots, data panels, data filters, and other elements that facilitate your analysis.

The Results window contains the following panes:

Tab Viewer

This pane provides you with a space to view individual tabs within the Results window. Use the tabs to access and view the output plots and associated data sets.

The following tabs are generated by this process:

Model Results: Contains a summary of the predictive model specification and the primary results of the fit.
Tree Diagram: Depicts the fitted tree.
Subtree Assessment: Plots misclassification rate versus number of leaves.
Variable Importance: Plots the relative importance of each predictor variable.

General

Click to surface the data sets corresponding to the active tab.
Click to reopen the completed process dialog used to generate this output.
Click to generate a pdf- or rtf-formatted report containing the plots and charts of selected tabs.
Click to close all graphics windows and underlying data sets associated with the output.