Scree Plot (Correlation and Principal Components)
The Scree Plot tab is shown below:
The Scree Plot tab contains the following elements:
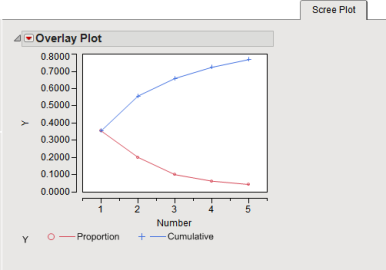
| • | Overlay Plot |
This scree plot shows the proportion of variability attributable to each principal component, and a complementary curve showing the cumulative proportion. The point at which the curves flatten is often taken as a visual indicator of a sufficient number of components. This plot can be helpful in deciding how many components adequately explain the data.
See Overlay Plot and Scree Plot for more information.