All Results
The All Results tab is shown below:
This tab contains the following elements:
| • | One or more Overlay Plots |
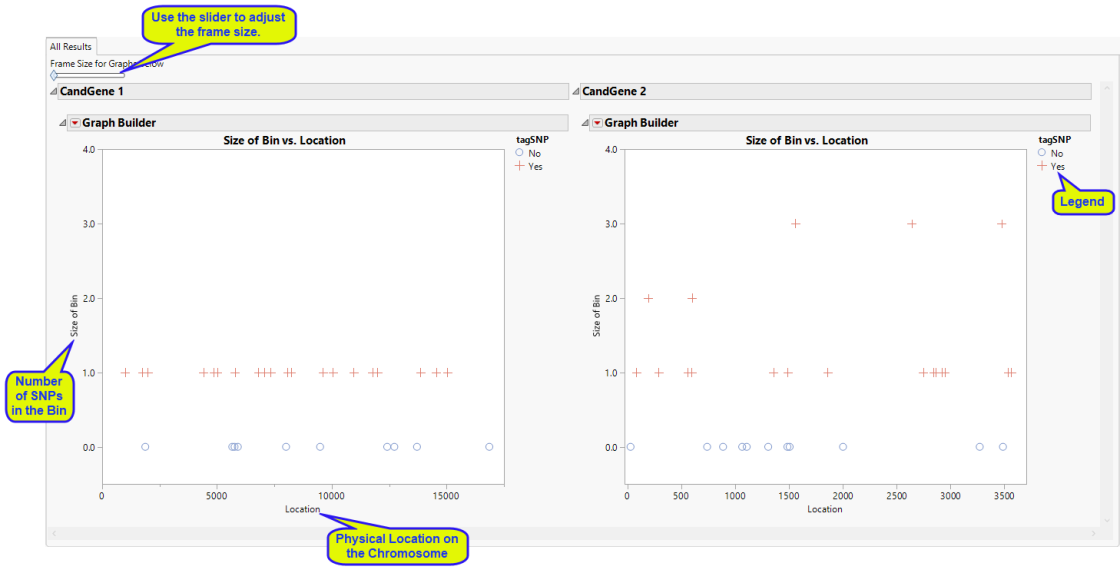
This tab displays a plot with SNP locations along the x-axis and the size (the number of SNPs) for the bin to which the SNP belongs along the y-axis. A separate plot is generated for each annotation group.
Each SNP is either given a blue plus symbol or a red circle indicating whether it has been selected as tag SNP or not, respectively.
If any BY variables were selected, a separate set of plots is shown for each BY group.