Clustering
The Clustering tab is shown below. Note, this example is for Hierarchical clustering.:

This tab contains the following elements:
| • | One two-dimensional SVD plot with a data filter |
This plot (shown in the figure above) shows the global structure of cell groups based on the first two principal components. The data filter enables you to more easily explore clusters and individual cells.
| • | One three-dimensional -dimensional SVD plot |
This plot (shown in the figure above) shows the global structure of cell groups based on the first three principal components.

| • | One Hierarchical Clustering section containing one dendrogram and a constellation plot. |
| • | The dendrogram (shown below) is constructed by using the first 20 principle components to cluster the cells into families based on their gene expression patterns. |
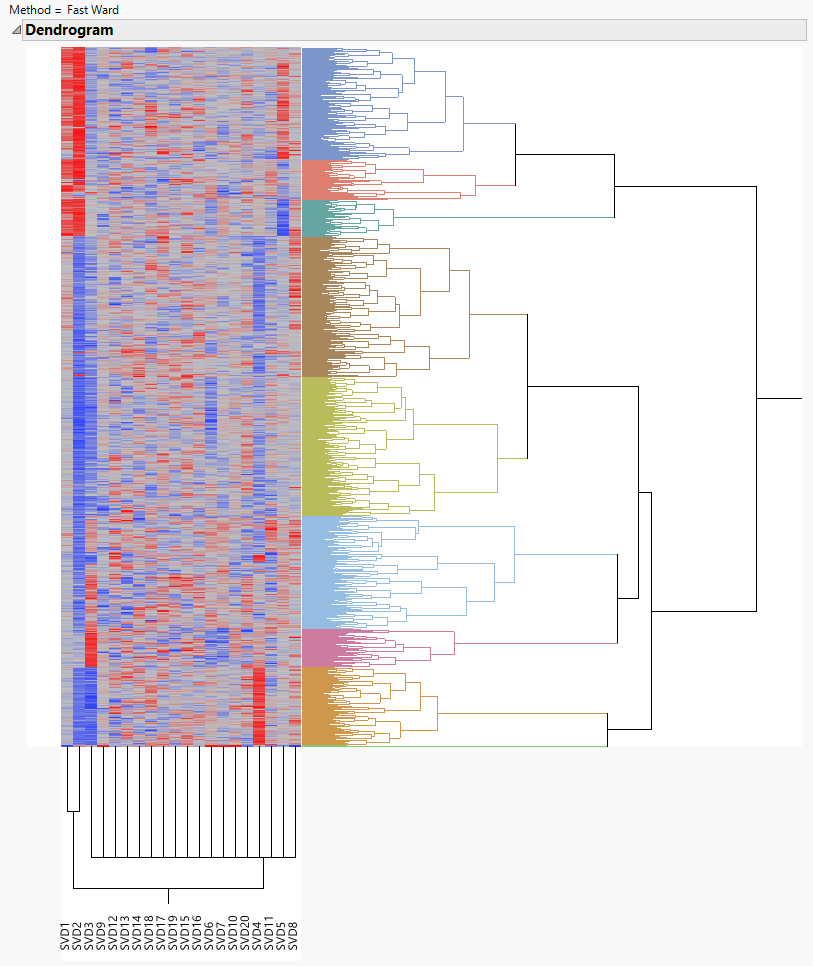
The first 20 principal components are shown on the x-axis and clusters of cells are shown on the y-axis.
| • | In the constellation plot (shown below) the clusters are shown as branches. This illustrations enables you to better visualize the relationship between clusters. |

| • | The parallel plot (shown below) shows the gene expression patterns for each of the nine clusters. |

Actions
| 8 | Use the drop-down menu to split the graphs based on one or more features. |
| 8 | You can exclude selected cells from the plots. |