Embedding
The Embedding tab shows the results of both tSNE and UMAP analyses. The Action Button enables you to toggle between the tSNE and the UMAP results.
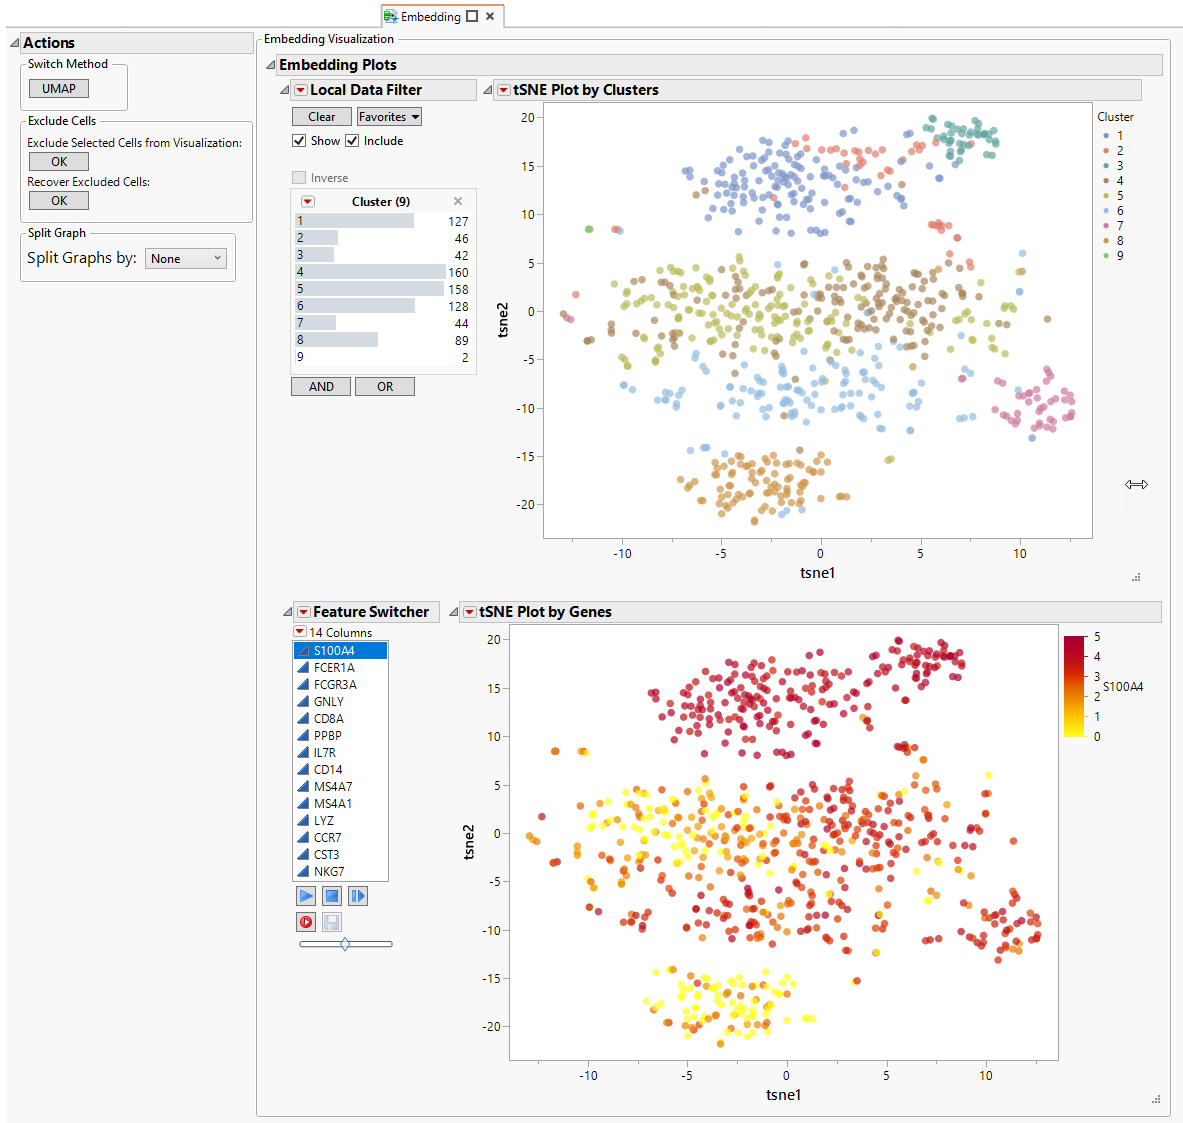
Each analysis generates the same pair of plots.
| • | One plot showing results colored by Clusters calculated in the Hierarchical Clustering. Each dot represents a cell. This plot helps visualize the distribution of the cell groups. |
| • | One plot showing results colored by level of gene expression. As before, each dot represents an individual cell. This plot helps to visualize the expression patterns of individual genes in the clusters. The Column Switcher enables you to navigate through a list of genes (all variable genes or list of marker genes provided by user). |
| • | A data filter that enables you to explore clusters and individual cells more easily |
Please refer to van der Maaten and Hinton (2008)1, van der Maaten (2014)2, and MacInnes and Healy (2018)3 for more information.
The plots for each analysis are shown below:
tSNE Plots
The tSNE plots are surfaced by default.
UMAP Results
The UMAP plots are surfaced when you click .

The Feature Switcher enables you to specify the gene to be examined.
Actions
| 8 | You can switch between tSNE and UMAP plots |
| 8 | You can exclude selected cells from the plots. |
| 8 | Use the drop-down menu to split the graphs based on one or more features. |