PCA Plot Grouping Variables
Use this field to specify those variables by which to group observations for drawing normal contour ellipsoids with 90% coverage on Principal Components Analysis Plots.
Leave this field empty if you do not want the ellipsoids to be drawn on the PCA.
To Specify One or More PCA Plot Grouping Variables:
| 8 | Specify the Experimental Design SAS Data Set (EDDS). |
All of the variables in the specified EDDS are displayed in the Available Variables field.
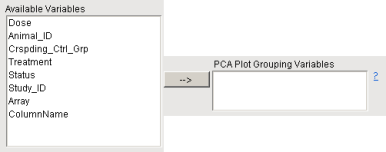
| 8 | Examine the list of available variables. |
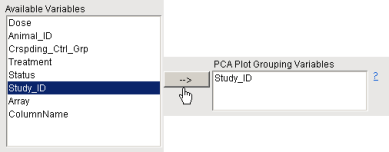
| 8 | Highlight the variable(s) by which to group the observations. To highlight multiple variables at once, hold down while left-clicking on them. |
| 8 | Click |