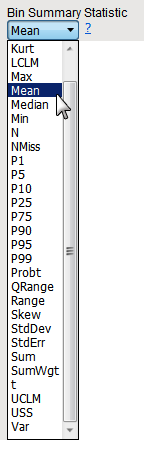
Bin Summary Statistic
Use the drop-down menu to select the statistic to compute for each bin.
Summary statistics are defined in the following table:
|
Statistic |
Description1 |
|
CSS |
Sum of squares corrected for the mean |
|
CV |
Percent coefficient of variance |
|
Kurt |
Kurtosis |
|
LCLM |
One-sided confidence limit below the mean |
|
Max |
Maximum value |
|
Mean |
Mean value |
|
Median |
Median value |
|
Min |
Minimum value |
|
N |
Number of values that are not missing |
|
Nmiss |
Number of missing values |
|
P1 |
1st percentile |
|
P5 |
5th percentile |
|
P10 |
10th percentile |
|
P25 |
25th percentile |
|
P75 |
75th percentile |
|
P90 |
90th percentile |
|
P95 |
95th percentile |
|
P99 |
99th percentile |
|
Probt |
Two-tailed p-value for Student's t statistic |
|
QRange |
Interquartile range |
|
Range |
Range from the minimum value to the maximum value |
|
Skew |
A Measure of the tendency of the deviations to be larger in one direction than the other |
|
StdDev |
Standard deviation |
|
StdErr |
Standard error |
|
Sum |
Sum of the values |
|
SumWgt |
Sum of the weights |
|
t |
Student’s t statistic |
|
UCLM |
One-sided confidence limit above the mean |
|
USS |
Uncorrected sum of squares |
|
Var |
Variance |
To Specify the Bin Summary Statistic:
| 8 | Left-click the Bin Summary Statistic drop-down. |
| 8 | Left-click the desired statistic. |
Refer to documentation for SAS PROC MEANS and SAS PROC SUMMARY for more information.