Process Description
Track Color Map
The Track Color Map process uses a SAS data set as input to create a settings (.sas) file that defines a track consisting of a heat map of one or more quantitative variables. This settings file can then be selected as a track file for embellishing various graphics plotted along a genome.
What do I need?
A single SAS data set, which contains color map variables, is required. The data must already be binned and its Y Variables must be specified in the dialog.
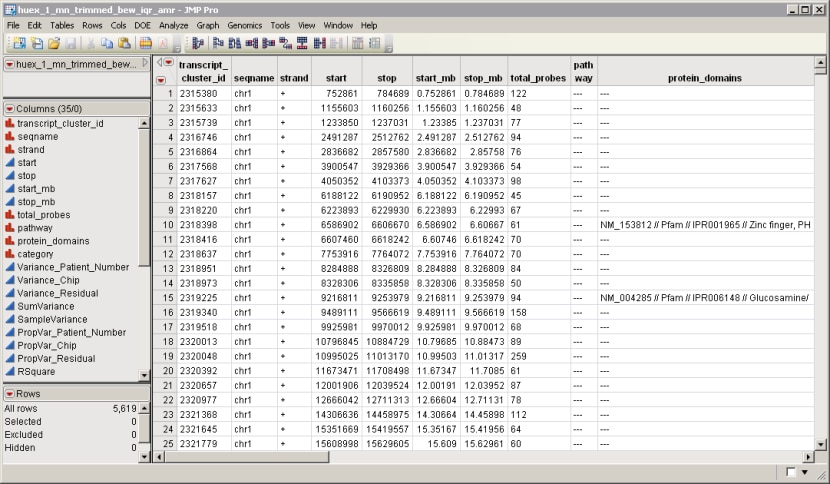
The huex_1_mn_trimmed_bew_iqr_amr.sas7bdat data set represents a subset of an IQR-normalized SAS data set (generated from the Affymetrix human exon data available in the JMP Genomics Sample Data\Copy Number folder, using the Basic Exon/Alternative Splicing Workflow), and serves as an example. It is partially shown below.
An additional data set, the Annotation Data Set, is optional unless the input data set does not contain the relevant annotation information. This data set contains information such as gene identity or chromosomal location, for each of the markers.
For detailed information about the files and data sets used or created by JMP Genomics software, see Files and Data Sets.
Output/Results
Running the Track Bar Chart process results in the generation of the TrackBarChart_-log10p Tissue by Probeset.sas settings file, whose path is displayed in a JMP Genomics Message window.
| 8 | Open this file with a text editor to see the SAS code shown below. |

This file can be used with any JMP Genomics process having a Tracks tab.