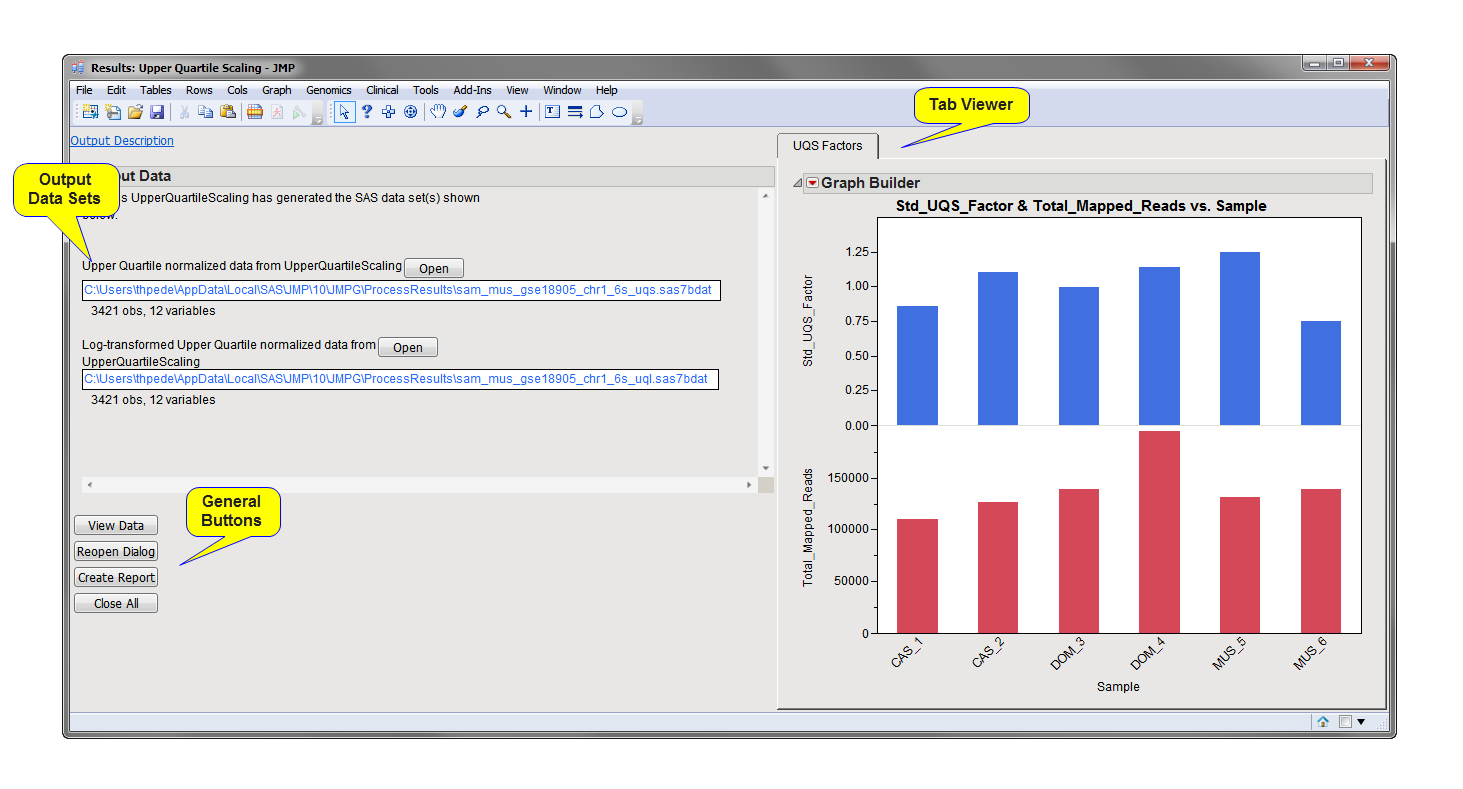
Running this process for the
GSE18905_chr1
sample setting generates the tabbed
Results
window shown below. Refer to the
Upper Quartile Scaling
process description for more information. Output from the process is organized into tabs. Each tab contains one or more plots, data panels, data filters, and so on, that facilitate your analysis.
The
Results
window contains the following panes:
This pane provides you with a space to view individual tabs within the
Results
window. Use the tabs to access and view the output plots and associated data sets.
|
•
|
UQS Factors
: This tab displays a two
bar charts
showing the scaling
factors
and the total mapped reads for each sample.
|
|
•
|
Output Normalized Data Set
: This data set (identified by the appended
_uqs
suffix) contains the normalized data in place of the values listed in the input data set. This data set can be used as input for a wide variety of analytical processes.
|
|
•
|
Output
Log
-Transformed Normalized Data Set
: This data set (identified by the appended
_uql
suffix) contains the
log
-transformed normalized data in place of the values listed in the input data set. This data set can be used as input for a wide variety of analytical processes.
|
Note
: You should visually evaluate the results of this process using the
Distribution Analysis
process before using the normalized data in subsequent analyses.
|
•
|
Click
to surface the data sets corresponding to the active tab.
|
|
•
|
Click
to reopen the completed process dialog used to generate this output.
|
|
•
|
Click
to generate a
pdf
- or
rtf
-formatted report containing the plots and charts of selected tabs.
|
|
•
|
Click
to close all graphics windows and underlying data sets associated with the output.
|