Running this process for the
MoroccoExample
sample setting generates the tabbed
Results
window shown below. Refer to the
LD Block Creation
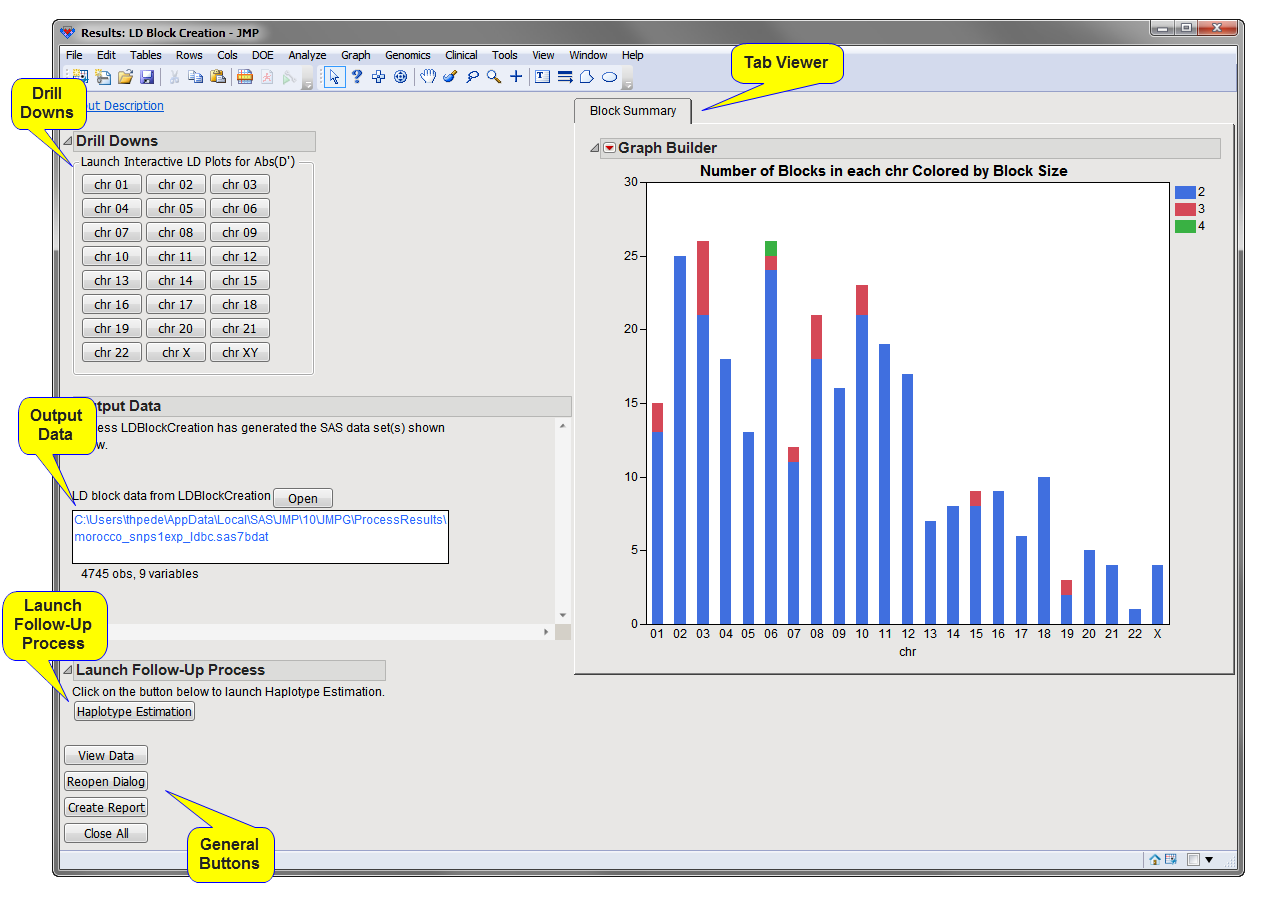
process description for more information. Output from the process is organized into tabs. Each tab contains one or more plots, data panels, data filters, and so on. that facilitate your analysis.
The
Results
window contains the following panes:
This pane provides you with a space to view individual tabs within the
Results
window. Use the tabs to access and view the output plots and associated data sets.
|
•
|
Block Summary
: This tab shows stacked
bar charts
of the number of blocks of particular sizes in each
chromosome
(or other value represented by the annotation group
variable
), with color representing the size (number of markers in the block).
|
|
•
|
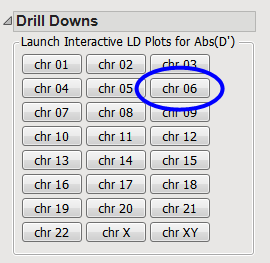
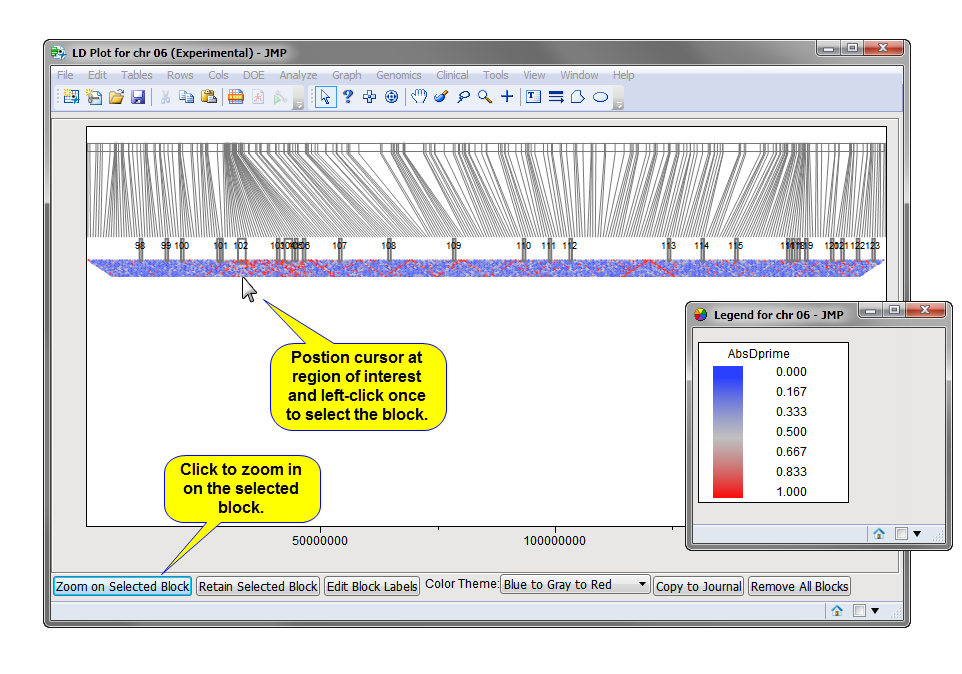
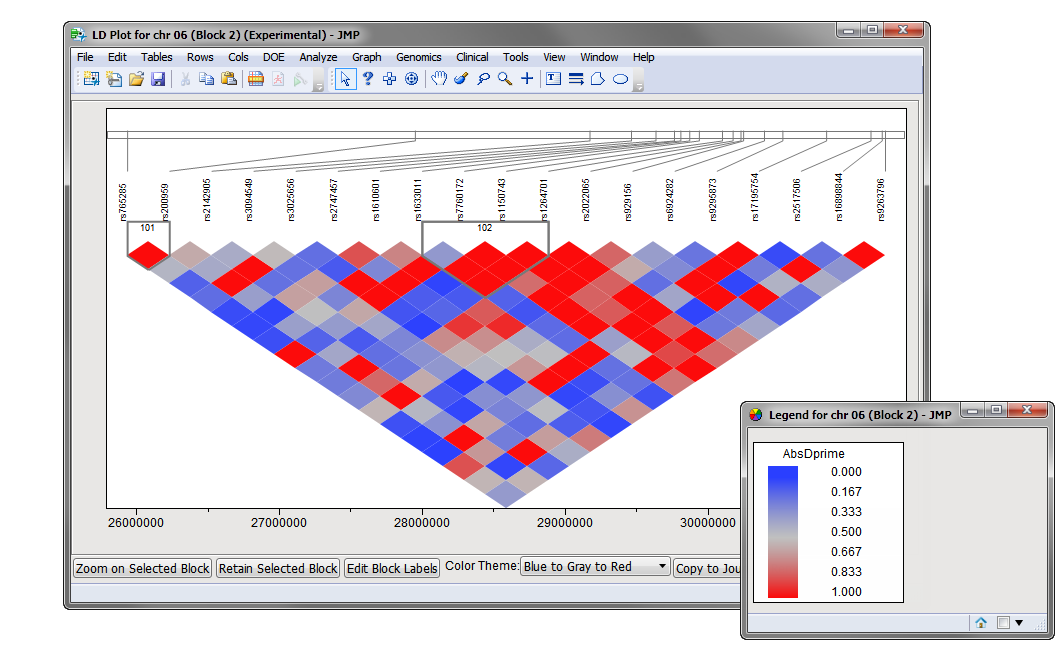
: There is one button per annotation group (or one for all markers if no annotation groups defined. Each button opens a window with a HaploView-style LD plot for that annotation group (chromosome, for example) along with a legend displaying the color gradient for the values for Abs(D').
|
|
•
|
Marker Statistics Data Set:
This data set contains the columns of the
annotation data set
along with a Block column indicating what, if any, block a
SNP
has been assigned to. Click
to view the data set.
|
For detailed information about the files and data sets used or created by JMP Life Sciences software, see
Files and Data Sets
.
|
•
|
Click
to reveal the underlying data table associated with the current tab.
|
|
•
|
Click
to reopen the completed process dialog used to generate this output.
|
|
•
|
Click
to generate a
pdf
- or
rtf
-formatted report containing the plots and charts of selected tabs.
|
|
•
|
Click
to close all graphics windows and underlying data sets associated with the output.
|