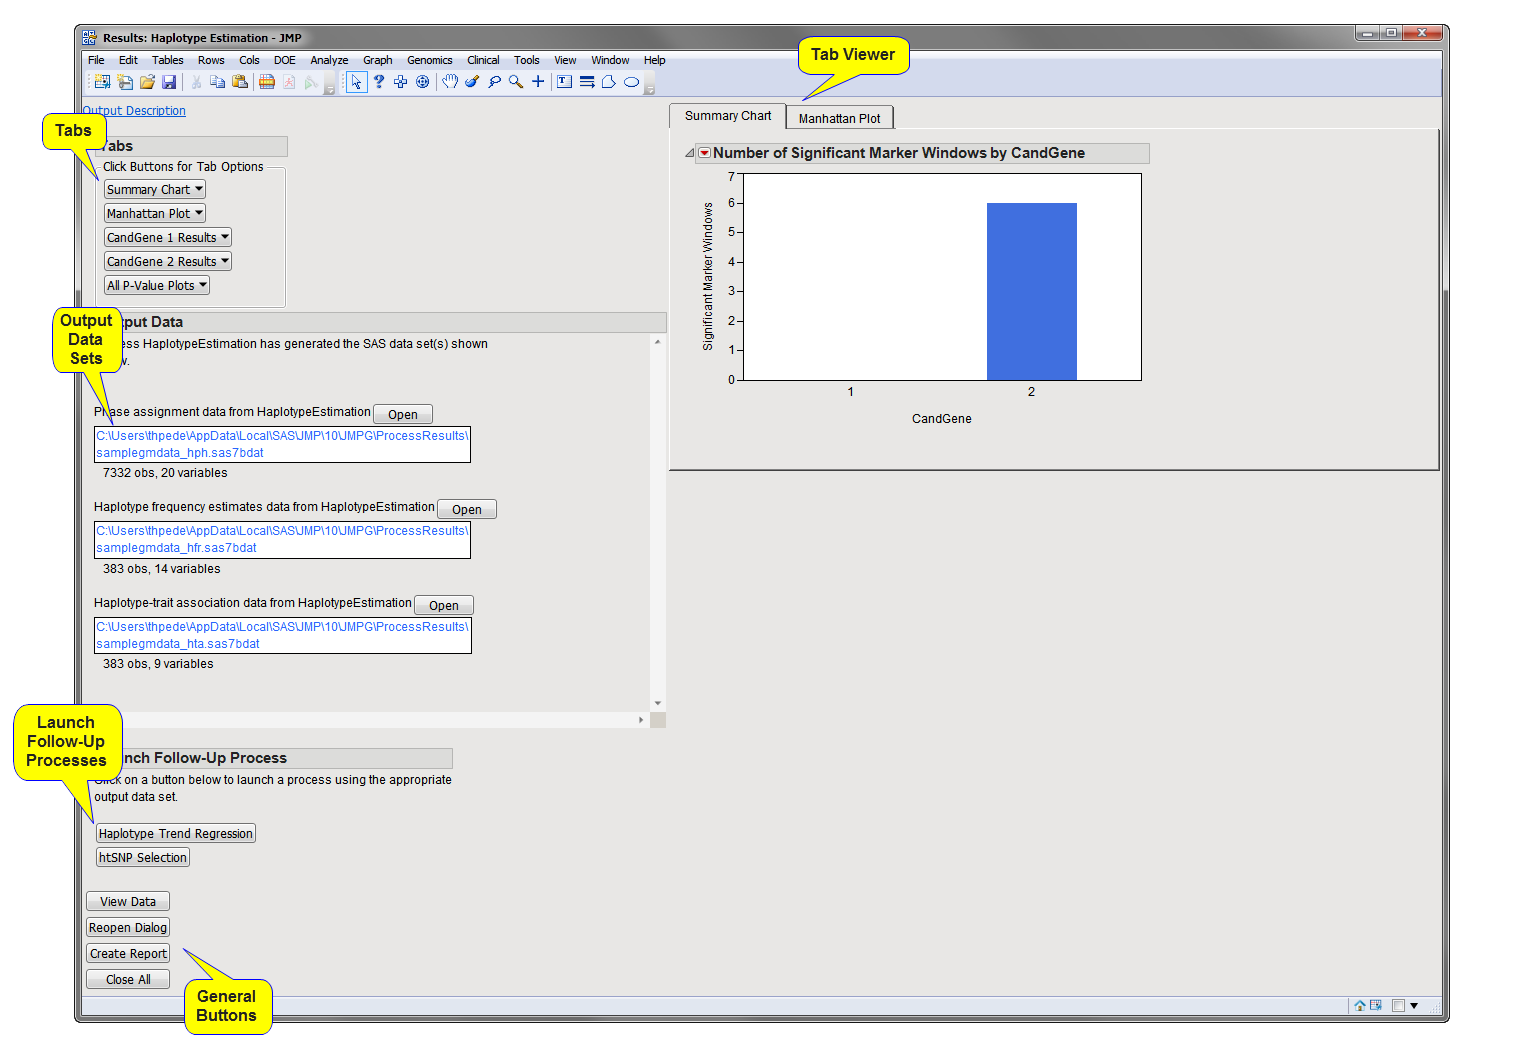
Running this process using the
GeneticMarkerExample
sample setting generates the tabbed
Results
window shown below. Refer to the
Haplotype Estimation
process description for more information. Output from the process is organized into tabs. Each tab contains one or more plots, data panels, data filters, and so on. that facilitate your analysis.
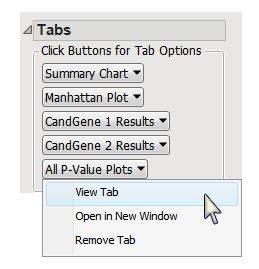
This pane enables you to access and view the output plots and associated data sets on each tab. Use the drop-down menu to view the tab in the
Tab Viewer
pane, open the tab in a new window, or remove the tab and its contents from the
Tab Viewer
pane.
|
•
|
Summary Chart
: When there are multiple annotation groups (
chromosomes
or genes, for example), this tab displays the number of significant markers in each annotation group for each test. Separate
bar charts
are shown for each
BY group
when any
BY variables
are specified. This tab is open by default.
|
|
•
|
Manhattan Plot
: When there are multiple annotation groups (chromosomes or genes, for example), this tab displays a scatter plot of the
p-values
across all annotation groups.
|
|
•
|
Annotation Group Results
: When there are multiple annotation groups (chromosomes or genes, for example), a separate
Results
tab is created for each annotation group with an
overlay plot
of
p
-value by chromosome location of the first marker in the marker windows.
|
In this example, there are two annotation groups (CandGene 1, and CandGene 2) and, thus two Annotation Group Results tabs (
CandGene 1 Results
and
CandGene 2 Results
).
|
•
|
All P-Value Plots
: When there are multiple annotation groups (chromosomes or genes, for example), the
All P-Value Plots
tab shows all the
p
-value plots from the
Annotation Group Results
tabs in a single display.
|
Note
: When an annotation group
variable
is not specified or there is only one annotation group, the tab is named
P-Value Plot
and contains an overlay plot of
p
-value by chromosome location for all markers.
|
•
|
Phase assignment Data Set
: This data set contains for each individual in the input data set, a row for all possible
haplotype
pairs for each marker window and the corresponding probability. This data set is generated when the
Create Phase Assignment Data Set
check box has been checked.
|
The haplotype pairs can be filtered by setting a minimum probability for the pair to be included in the data set in the
Phase Assignment Probability Cutoff
option. Alternatively, if the
Output most probable haplotype pair only
check box is checked, only the single most probable haplotype pair is included for each individual in a marker window.
This data set also includes any By Variables and selected Phase Assignment ID Variables and thus can be used as the input data set for
Haplotype Trend Regression
process.
The name of this data is set is given by the
Output File Prefix
, or input data set name if none given, with the suffix
_hph
.
|
•
|
Haplotype Frequency Estimates Data Set
: This data set contains the frequency estimate for each haplotype at each marker window. This data set is generated when the
Create data set containing haplotype frequency estimates
check box has been checked.
|
When the
Test allelic association (LD)
check box has been checked, frequencies under both the
null hypothesis
(H0) of no LD (the product of the
allele
frequencies) and under the
alternative hypothesis
(H1) that accounts for LD are included in the output. When this option is not checked, only the estimated frequencies under the alternative hypothesis are included (calculated using the EM or StepEM algorithm).
This data set can be used as the input data set for the
htSNP Selection
process or as the
Haplotype Frequency Data Set
in the
Haplotype Trend Regression
process.
The name of this data is set is given by the
Output File Prefix
, or input data set name if none given, with the suffix
_hfr
.
|
•
|
Haplotype-Trait Association Data Set
: This data set includes a
chi-square
test for different haplotype frequencies between the two values of the
trait
variable. This data set is generated when a
Binary Trait Variable
has been selected and the
Test Individual Haplotypes
check box has been checked,
|
The name of this data is set is given by the
Output File Prefix
, or input data set name if none given, with the suffix
_hta
.
For detailed information about the files and data sets used or created by JMP Life Sciences software, see
Files and Data Sets
.
|
•
|
Haplotype Trend Regression
: Click
to launch the
Haplotype Trend Regression
process with the
Phase Assignment
data set and the
Haplotype Frequency Estimates
data set preloaded as input.
|
|
•
|
htSNP Selection
: Click
to launch the
htSNP Selection
process with the
Haplotype Frequency Estimates
data set preloaded as input.
|
|
•
|
Click
to reveal the underlying data table associated with the current tab.
|
|
•
|
Click
to reopen the completed process dialog used to generate this output.
|
|
•
|
Click
to generate a
pdf
- or
rtf
-formatted report containing the plots and charts of selected tabs.
|
|
•
|
Click
to close all graphics windows and underlying data sets associated with the output.
|