Running this process using the
sf2
sample setting generates the tabbed
Results
window shown below. Refer to the
GxE Interaction
process description for more information. Output from the process is organized into tabs. Each tab contains one or more plots, data panels, data filters, and so on. that facilitate your analysis.
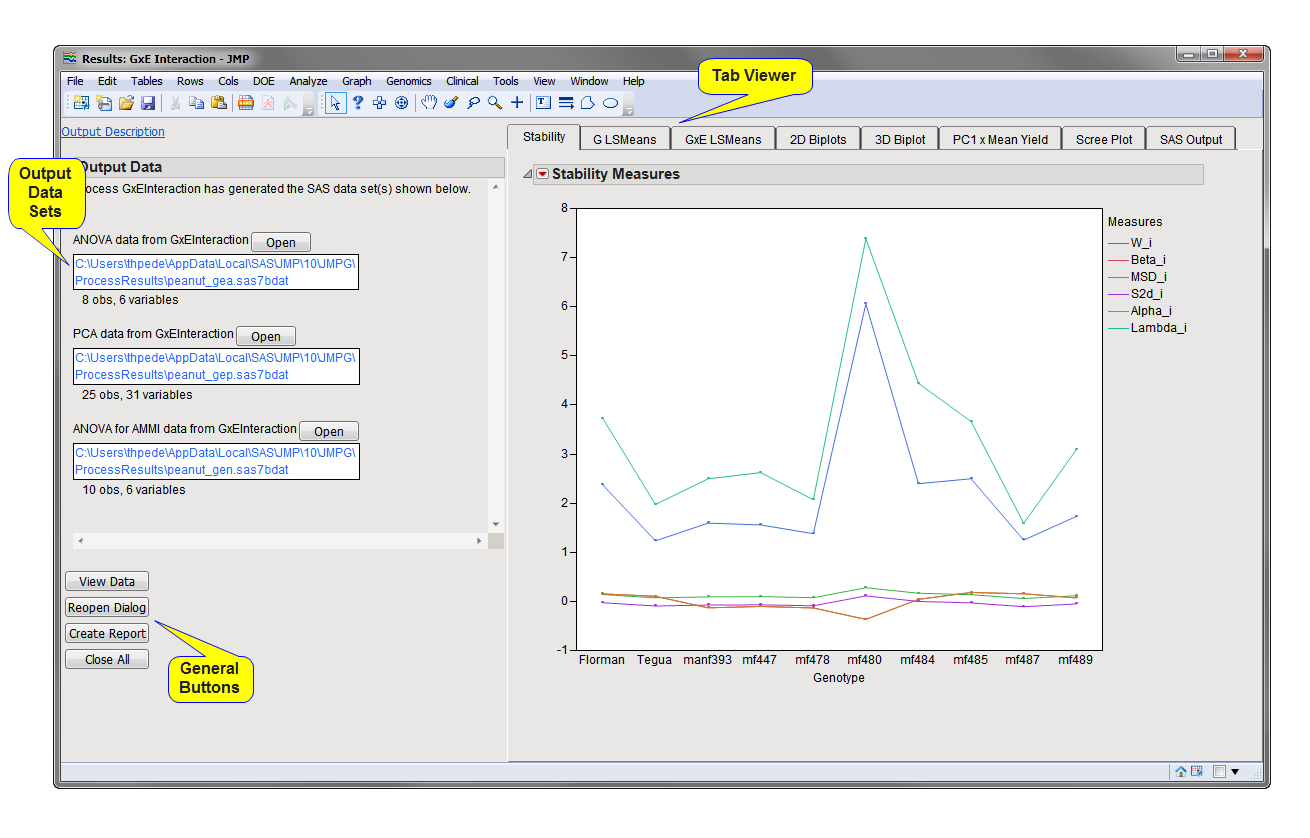
This pane provides you with a space to view individual tabs within the
Results
window. Use the tabs to access and view the output plots and associated data sets.
|
•
|
|
•
|
GxE LSMeans
: This tab displays estimates of LS means for the trait for the Genotype x
Environment
interaction effect, with a line for each environment colored distinctly.
|
|
•
|
2D Biplots
: This tab displays 2-D plots of PC2 by PC1, PC3 by PC1, and PC3 by PC2, where PC1-PC3 are the first three
principal components
from the linear-bilinear model (AMMI, for example). In these plots and the ones on the next two tabs, genotypes are represented by blue triangles and environments are represented by red circles.
|
|
•
|
3D Biplot
: This tab shows a 3-D plot of PC1, PC2, and PC3, the first 3 principal components from the linear-bilinear model.
|
|
•
|
PC1 x Mean Trait
: This tab displays a biplot of PC1, the first principal component from the linear-bilinear model, by the
mean
of the Trait Variable.
|
|
•
|
Scree Plot (GxE Interaction)
: This tab displays the
scree plot
for the principal components from the linear-bilinear model, plotting the
eigenvalue
by principal component in red, and the cumulative proportion explained by the PCs in blue.
|
|
•
|
SAS Output
: When there is only one Quantitative Trait selected, this tab shows the heritability calculated by PROC MIXED in SAS, and the
ANOVA
results from fitting the GxE model with PROC GLM.
|
ANOVA Data Set
: This data set contains the ANOVA statistics from fitting the GxE model.
PCA Data Set
: This data set contains the principal component
eigenvectors
from the linear-bilinear model.
ANOVA for Linear-Bilinear Model Data Set
: This data set contains the ANOVA from fitting the linear-bilinear model that includes principal components to represent the GxE component.
|
•
|
Click
to reveal the underlying data table associated with the current tab.
|
|
•
|
Click
to reopen the completed process dialog used to generate this output.
|
|
•
|
Click
to generate a
pdf
- or
rtf
-formatted report containing the plots and charts of selected tabs.
|
|
•
|
Click
to close all graphics windows and underlying data sets associated with the output.
|