Running this process using the
GeneticMarkerExample
sample setting generates the tabbed
Results
window shown below. Refer to the
Cross Evaluation
process description for more information. Output from the process is organized into tabs. Each tab contains one or more plots, data panels, data filters, and so on. that facilitate your analysis.
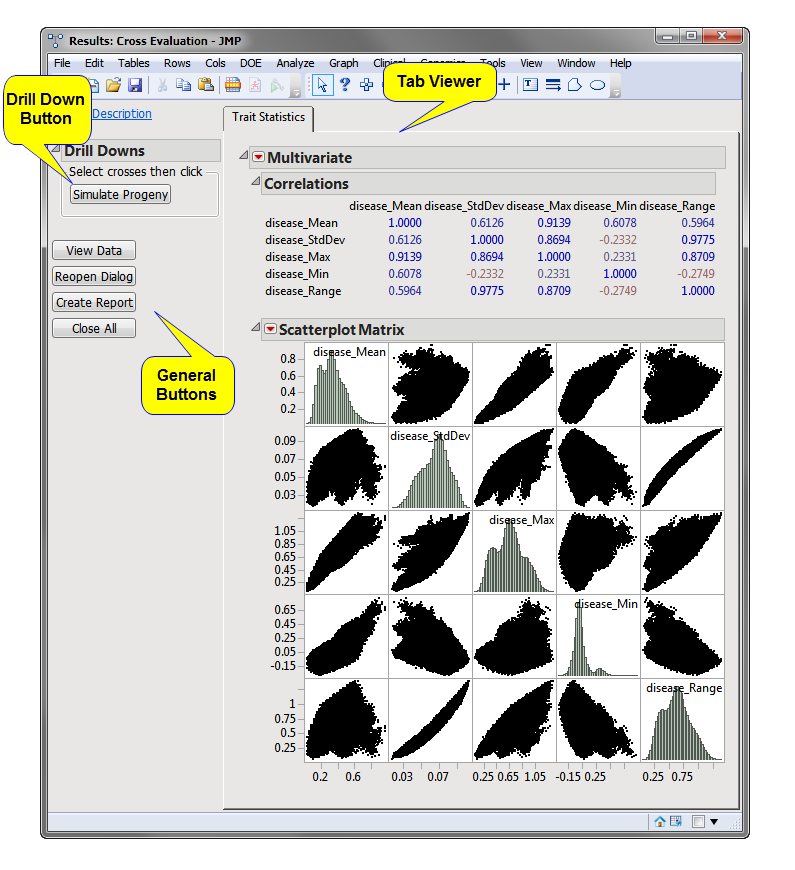
This pane provides you with a space to view individual tabs within the
Results
window. Use the tabs to access and view the output plots and associated data sets.
|
•
|
Trait Statistics
: This tab shows a
scatterplot
matrix of the correlation of various statistics for the assessed
trait
among progeny of the crosses.
|
|
•
|
: Launches the
Progeny Simulation
process with the data and specifications from this process preloaded as input.
|
|
•
|
Click
to reveal the underlying data table associated with the current tab.
|
|
•
|
Click
to reopen the completed process dialog used to generate this output.
|
|
•
|
Click
to generate a
pdf
- or
rtf
-formatted report containing the plots and charts of selected tabs.
|
|
•
|
Click
to close all graphics windows and underlying data sets associated with the output.
|