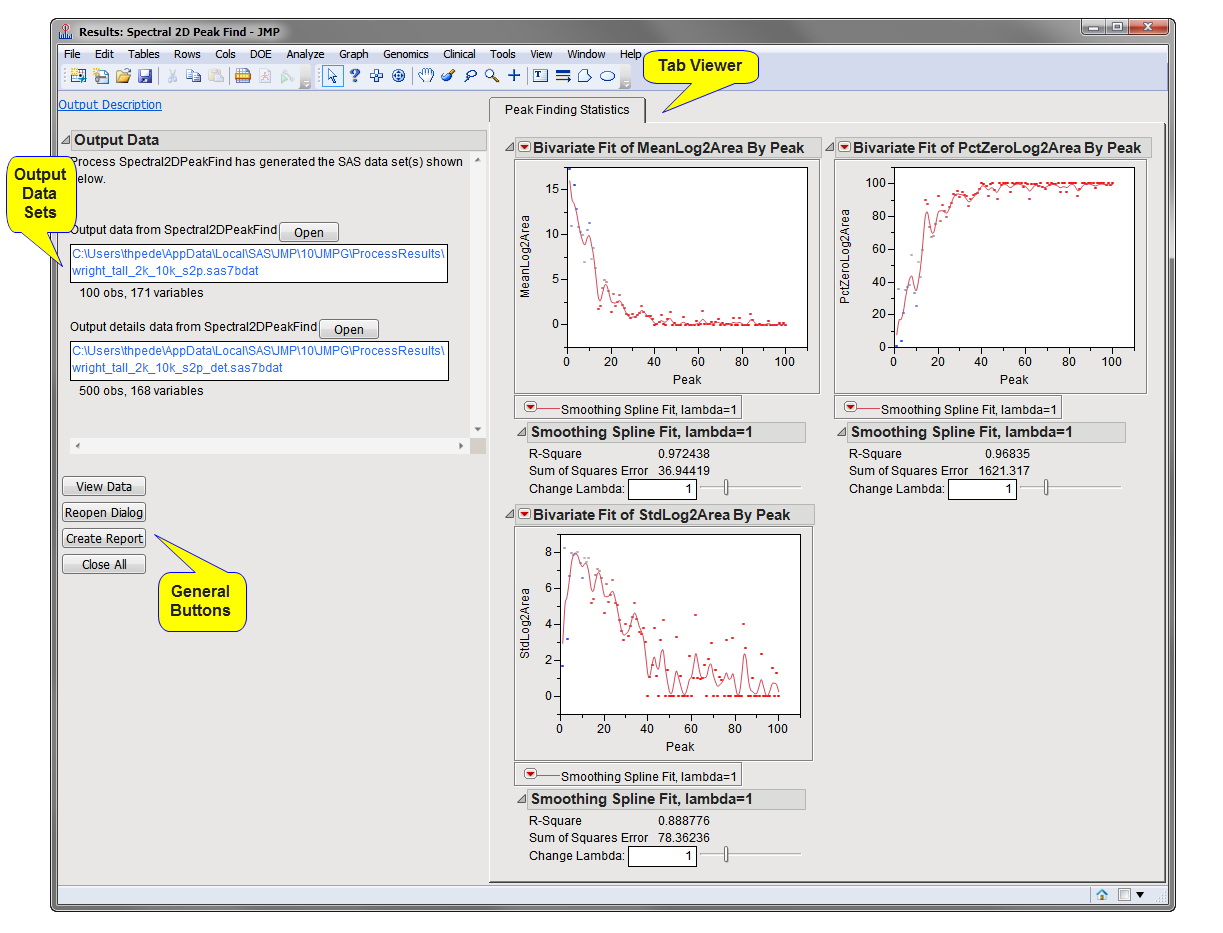
Running this process for the
ProstateCancerExample
sample setting generates the tabbed
Results
window shown below. Refer to the
2D Peak Find
process description for more information. Output from the process is organized into tabs. Each tab contains one or more plots, data panels, data filters, and so on. that facilitate your analysis.
The
Results
window contains the following panes:
This pane provides you with a space to view individual tabs within the
Results
window. Use the tabs to access and view the output plots and associated data sets.
|
•
|
Peak Finding Statistics
: This tab displays
bivariate
plots showing the statistics for the peaks.
|
|
•
|
Output Data Set
: This data set lists the peaks for each of the input spectra. Each portion of the spectra not exceeding the “noise” estimates are identified with a
0
. Five additional columns are added to this data set identifying the peaks and providing statistics on those peaks. This data set is identified by the appended
_s2p
suffix.
|
|
•
|
Output Details Data Set
: This data set provides additional details (upper and lower boundary, mode, area, and height) for each of the peaks identified across the spectra. This data set is identified by the appended
_s2p_det
suffix.
|
|
•
|
Click
to reveal the underlying data table associated with the current tab.
|
|
•
|
Click
to reopen the completed process dialog used to generate this output.
|
|
•
|
Click
to generate a
pdf
- or
rtf
-formatted report containing the plots and charts of selected tabs.
|
|
•
|
Click
to close all graphics windows and underlying data sets associated with the output.
|