The
Correlation and Principal Component
process computes correlations between
numeric variables
,
principal components
of the correlation matrix and an accompanying outlier analysis. It also optionally computes a
variance
components decomposition that helps you determine the major sources of overall variability in your experiment.
The first data set, the
Input Data Set
, contains all of the numeric data to be analyzed. This data set must be in the
tall
format where each sample corresponds to one row and each column corresponds to a separate experimental condition or array.
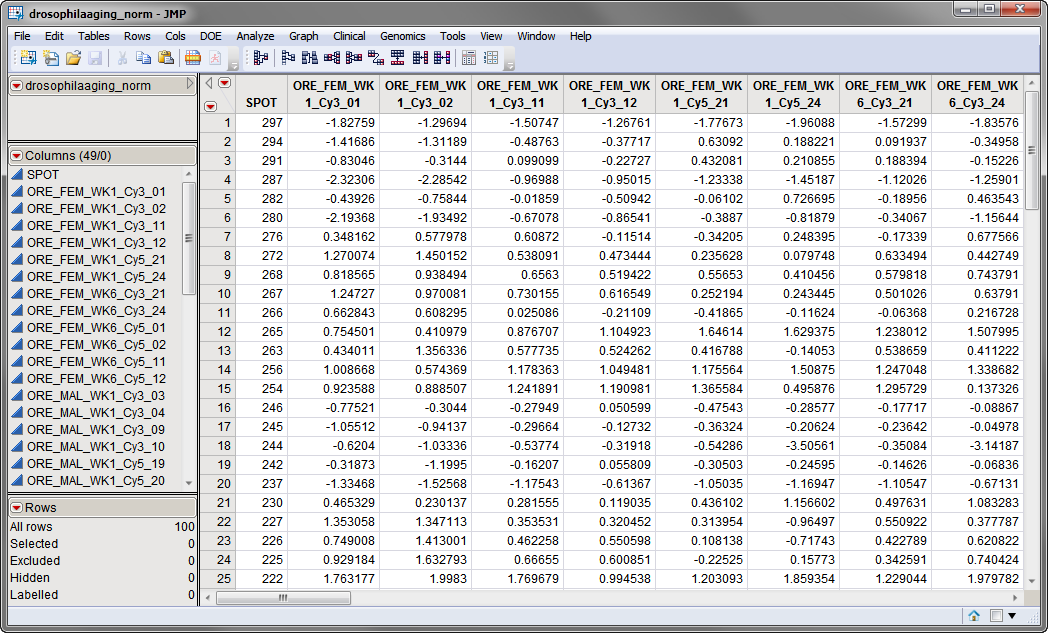
The
drosophilaaging_norm.sas7bdat
data set, shown below, is a normalized data set derived from the
Drosophila
Aging experiment described in
Sample Case Studies
. It has 49 columns and 100 rows corresponding to 49 arrays and 100 individual
probes
, respectively.
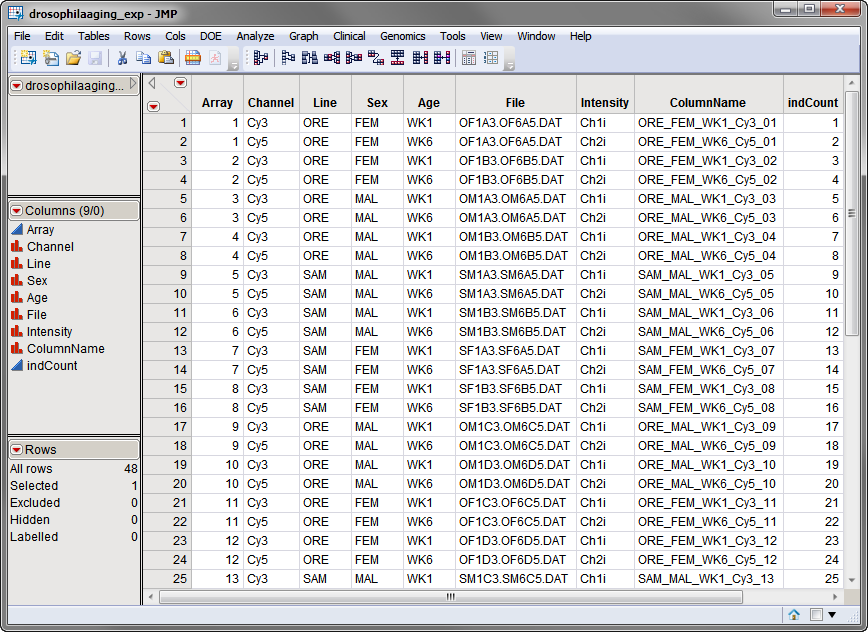
The second data set is the
Experimental Design Data Set (EDDS)
. This required data set tells how the experiment was performed, providing information about the columns in the input data set. Note that one column in the EDDS must be named
ColumnName
and the values contained in this column must exactly match the column names in the input data set.
The
drosophilaaging_exp.sas7bdat
EDDS, is shown below. Note that the
ColumnName
column lists the column names in the input data set. The
Array
column corresponds to an
index variable
. Note the
variables
describing experimental conditions.
For detailed information about the files and data sets used or created by JMP Life Sciences software, see
Files and Data Sets
.
The output generated by this process is summarized in a Tabbed report. Refer to the
Correlation and Principal Variance Component Analysis
output documentation for detailed descriptions and guides to interpreting your results.