Genetic data sets are often quite large and analyses with these large data sets require significant computational resources and time. It is often useful, particularly for preliminary analyses of the major features in the data, to reduce the number of
variables
by using only a representative set.
The
LD tagSNP Selection
process uses the
linkage disequilibrium
measure
R
2
(the square of the
correlation coefficient
) between pairs of
SNPs
to separate the SNPs into
bins
, using the binning algorithm developed by Carlson
et al.
(2004), and identifies
tagSNPs
that can be used to represent all the SNPs in a bin. This procedure effectively reduces the total number of SNPs (and hence, the number of columns) in the main data set to a more manageable number, increasing the efficiency of
association
studies.
One
Input Data Set
is needed for this process. The
samplegmdata.sas7bdat
data set used in the following example was computer generated and consists of 1000 rows of individuals with 130 columns corresponding to data on these individuals. There are 2 categorical phenotypic variables (
sex
and
disease
status) and 4 quantitative phenotypic variables (
Qtrt1
,
Qtrt2
,
Qtrt3
, and
Qtrt4
).
Genotypes
for 60 different markers are presented in the two-column
allelic
format (
ma1
—
ma120
). This data set is partially shown below.
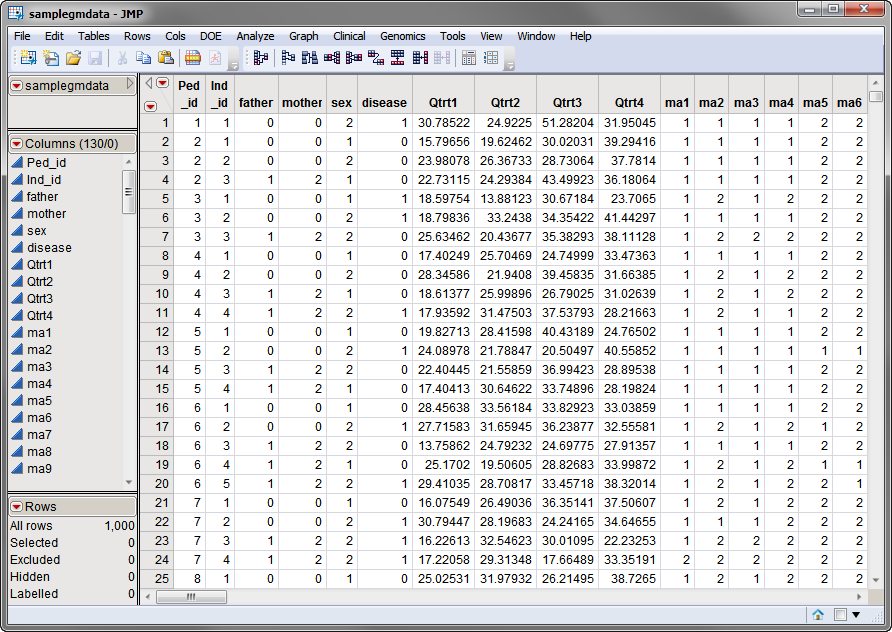
Note that this is a wide data set;
phenotypes
and markers are listed in columns, whereas individuals are listed in rows.
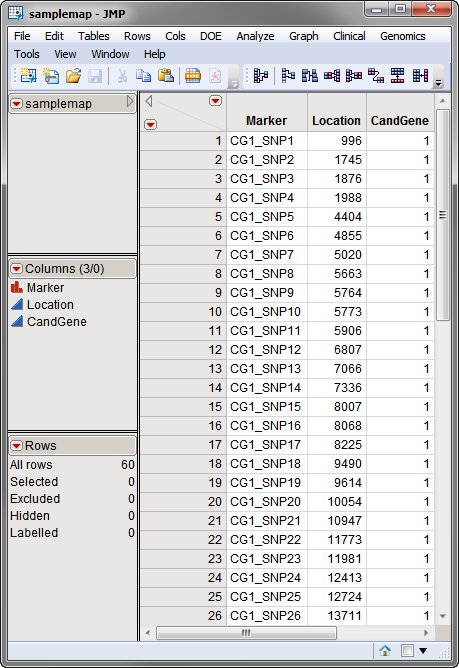
The second, optional, data set is the
Annotation Data Set
. This data set contains information, such as gene identity or chromosomal location, for each of the markers. The
annotation data set
used in this example, the
samplemap
data set, was computer generated and identifies markers, location and gene identities. A portion of this data set is illustrated below. This data set is a tall data set; each row corresponds to a different marker.
Note
: The top-to-bottom order of the rows in the annotation data set matches the left-to-right order of the columns in the input data set. This correspondence is required for markers to be matched appropriately.
Both data sets are
described in
Data Sets Used in JMP Genomics Processes
and
are included in the
Sample Data
folder.
For detailed information about the files and data sets used or created by JMP Life Sciences software, see
Files and Data Sets
.
The output generated by this process is summarized in a Tabbed report. Refer to the
LD tagSNP Selection
output documentation for detailed descriptions and guides to interpreting your results.