The
Genetics Q-K Analysis Workflow
process runs a
workflow
for calculating
Q
and
K
matrices to adjust for
population
structure and relatedness between individuals, respectively, and then runs a
Q-K
mixed model (Yu
et al
. 2006) to test for
association
between individual
SNPs
and one or more
traits
. The workflow contains the following processes:
|
1
|
Recode Genotypes
or
Expand Multiallelic Genotypes
- The former process is run i
f the columns of
marker variables
do not contain numeric
genotypes
, and by default converts multiallelic markers to biallelic markers before performing any calculations or analysis. The latter process, run when the option to perform multiallelic analyses on multiallelic markers is enabled, creates Q and K matrices using expanded genotypes.
|
|
2
|
PCA for Population Stratification
- This process is run to calculate the
Q matrix
using
principal components
(Zhao
et al.
2007),
|
|
3
|
Relationship Matrix
- This process is run to calculate the root of the
IBD
(
K
) matrix representing relatedness between individuals,
|
|
4
|
K Matrix Compression
- This process can be run to create a smaller-dimension
K matrix
using an optimized
clustering
algorithm (Zhang et al. 2010),
|
|
5
|
Q-K Mixed Model
or
Marker-Trait Association
- The former process uses the
Q
and
K
matrices as fixed and random components, respectively, in a
mixed models
to test for association between each SNP and the traits of interest. The latter process, run when the option to perform multiallelic analyses on multiallelic markers is enabled, uses the Q and K matrices derived from expanded genotypes along with the original genotypes with all
alleles
included in the
model
simultaneously.
|
One wide-formatted
input
SAS data set, containing all of the marker data, is
required
to run the
Genetics Q-K Analysis Workflow
process.
The input data set should have the
NxM
wide format with:
|
•
|
N
samples (individuals) as rows, and
|
|
•
|
M
markers as columns (or 2M columns for marker variables in
Allele
format).
|
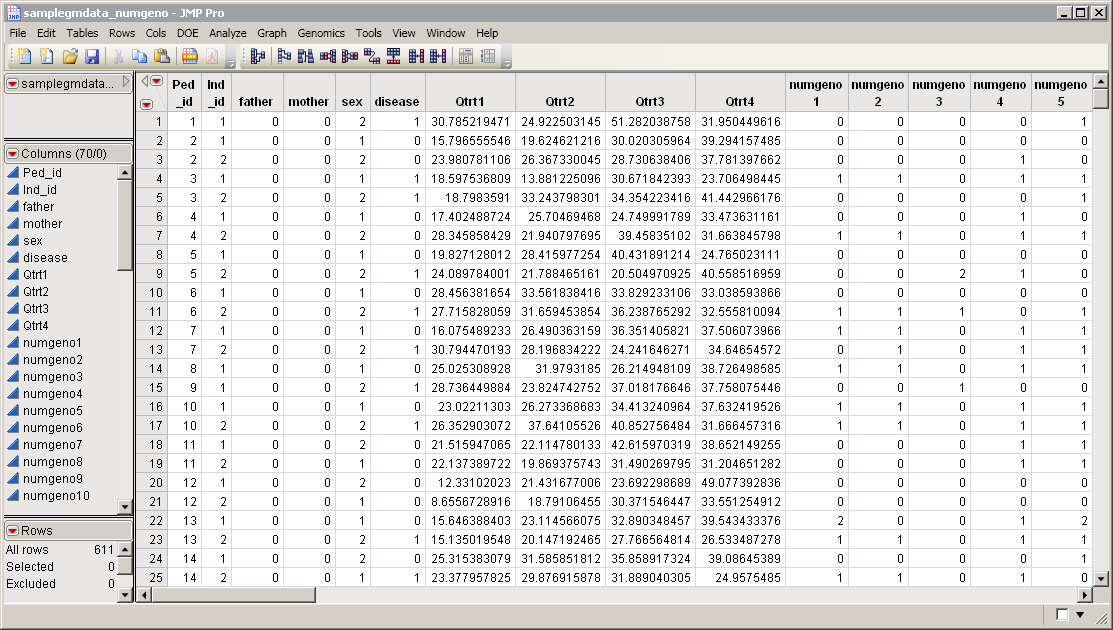
The
samplegmdata_numgeno.sas7bdat
data set serves as an example. It was computer generated and consists of 1000 rows of individuals with 70 columns corresponding to data on these individuals. In this data set, genotypes for 60 markers (
numgeno1
-
numgeno60
), are presented in the one-column format. This data set is partially shown below. Note that this is a wide data set; markers are listed in columns, whereas individuals are listed in rows.
An
Annotation Data Set
is
optional
. This data set contains information such as gene identity or chromosomal location, for each of the markers. The
samplemap_numgeno.sas7bdat
data set serves as an example, and is partially shown below. It identifies markers, location, and gene identities. This data set is a tall data set; each row corresponds to a different marker.
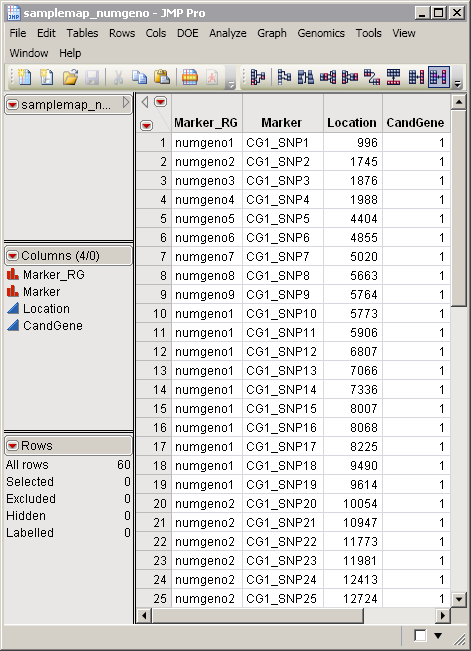
Note
: The top-to-bottom order of the rows in the
annotation data set
matches the left-to-right order of the columns in the input data set. This correspondence is required for markers to be matched appropriately.
Both the
samplegmdata_numgeno.sas7bdat
input data set and the
samplemap_numgeno.sas7bdat
annotation data set
are located in the
Sample Data\Genetics
directory included with JMP Genomics.
For detailed information about the files and data sets used or created by JMP Life Sciences software, see
Files and Data Sets
.
When you click
, the
Genetics Q-K Analysis Workflow
process begins by opening the
Workflow Builder
. The
Workflow Builder
builds a
settings file
for each process, containing the information from the data sets and parameters specified in the
Genetics Q-K Analysis Workflow
dialog
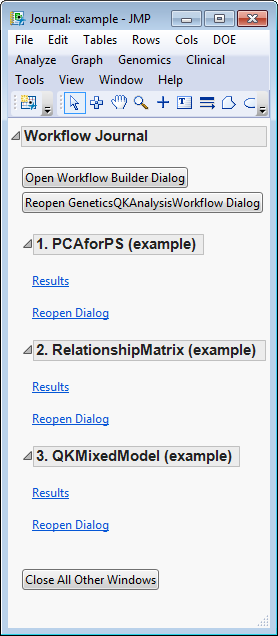
. Once the setting files are generated and saved, the individual processes in the workflow are sequentially opened, populated, and run. The results of the processes are saved in the specified output folder. Finally, a JMP
journal
, providing links to the workflow dialog and the results of each process, is generated.
|
|
Click
.
|
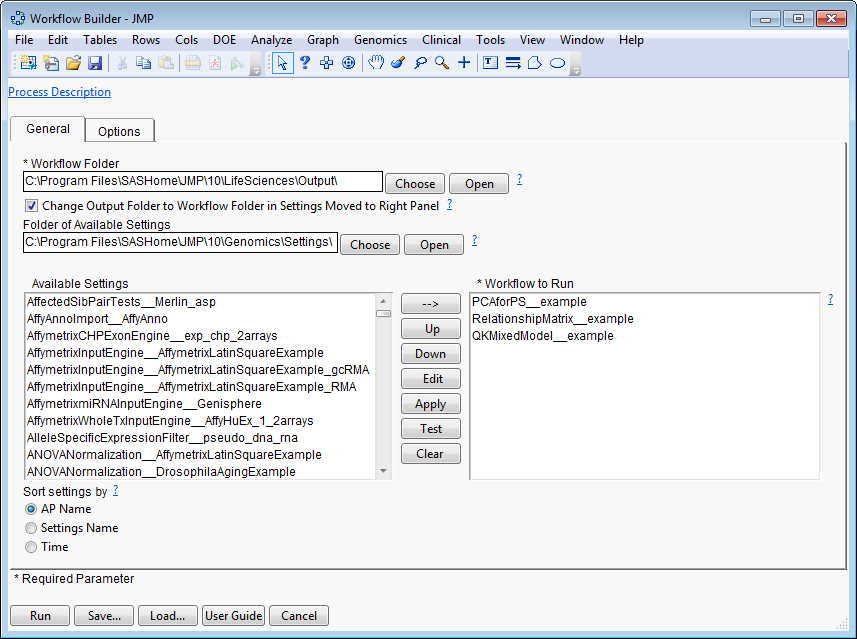
The
Workflow Builder
dialog shows the settings for each of the processes in the workflow. You can select and edit individual settings to adjust your analysis.
|
|
Clicking each of the
buttons on the journal brings up the output of each of the processes. This enables you to examine each set of output so that adjustments can be made to the individual settings, as needed. For your convenience, links to the default
Genetics Q-K Analysis Workflow
processes are given below.
|