Plot Intensities
enables you to visualize row-level intensity measurements for individual samples via
parallel plots
. Measurements and plots can be placed into groups as defined in an experimental design data set. You can either select rows in a tall data table to plot based on the values of group-level statistics, or choose rows to include by filtering on annotation values.
Caution and Tip
: This process can be slow if you plot thousands of profiles. If you are plotting a large number of profiles, you should filter the data, using the available filtering options, and plot selected subsets.
One
Input Data Set
, containing all of the numeric data (for example,
expression
measurements) to be analyzed, is required to run this process. The data set must be in
tall
format, in which columns are arrays or samples, and rows are molecular entities.
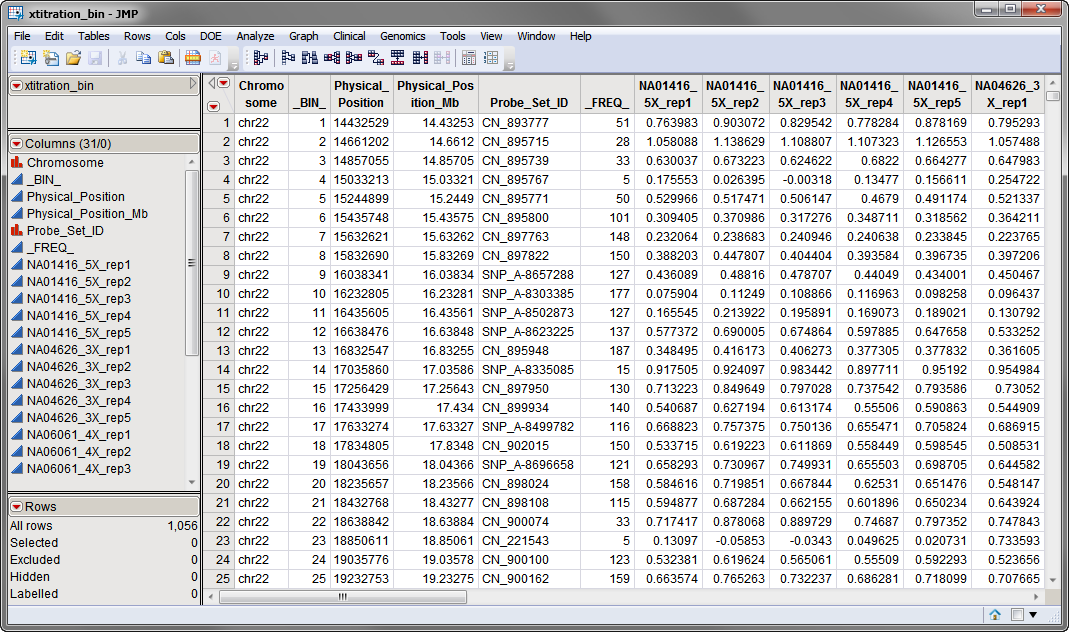
The sample data set used in the following example, the
xtitration_bin.sas7bdat
data set, is partially shown below. It has 31 columns and 1056 rows. Note that this is a
binned
data set; each row corresponds to a group of
observations
taken from the same localized region of a
chromosome
.
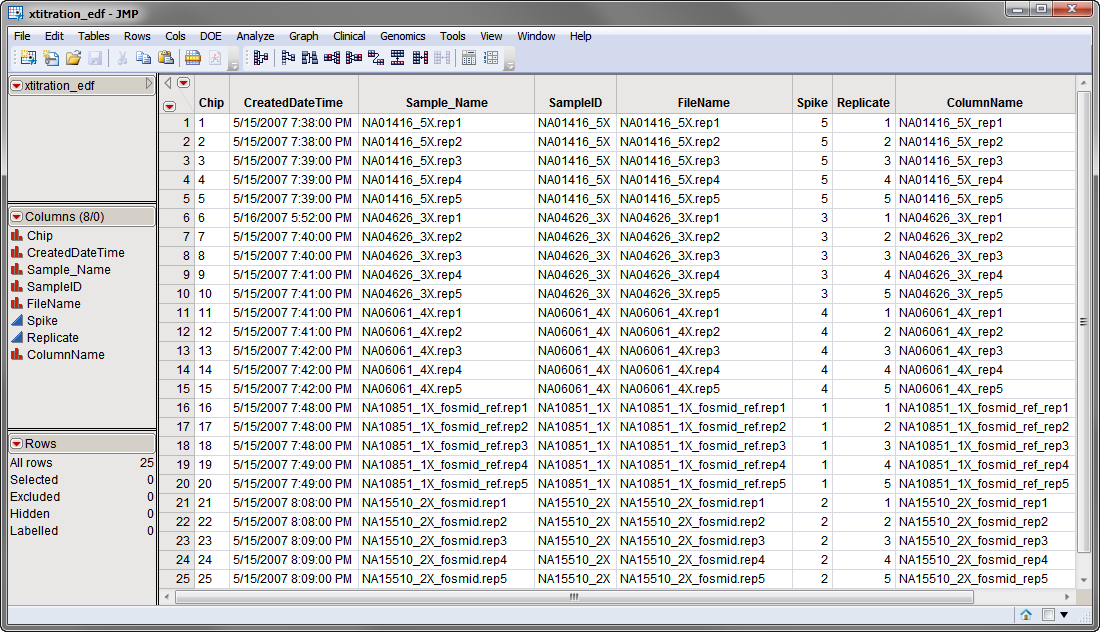
A second, optional, data set is the
Experimental Design Data Set (EDDS)
. This data set tells how the experiment was performed, providing information about the columns in the input data set. Note that one column in the EDDS must be named
ColumnName
and the values contained in this column must exactly match the column names in the input data set.
An
Annotation Data Set
can also be specified. This data set contains information, such as gene identity or chromosomal location, for each of the rows in the input data set.
For detailed information about the files and data sets used or created by JMP Life Sciences software, see
Files and Data Sets
.
The output generated by this process is summarized in a Tabbed report. Refer to the
Plot Intensities
output documentation for detailed descriptions and guides to interpreting your results.