The
Venn Diagram - Single Table
process is a
JMP Scripting Language
(JSL) script that enables you to examine and compare
variables
in a data set using
Venn diagrams
to explore their similarities and differences and to identify
observations
of special interest.
You must have a JMP table open and in focus before you can open the
Venn Diagram
process. Only
binary variables
can be assessed. Values in the variables are restricted to
0
and
1
.
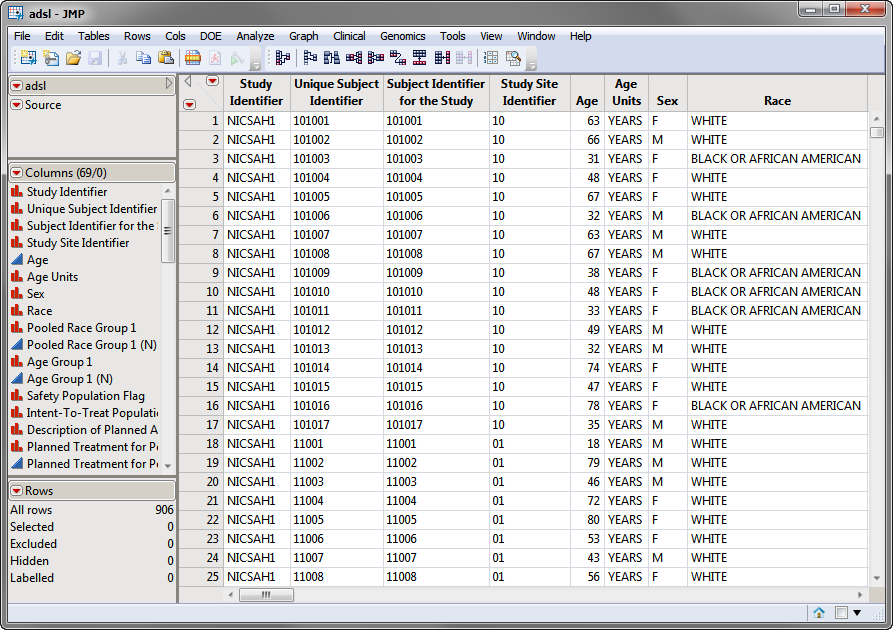
The
adsl.sas7bdat
data set (found in the \
LifeSciences\Sample Data\Nicardipine\ADaM
directory included with JMP Genomics and JMP Clinical, and described in
Nicardipine
) can be used as an example.
For detailed information about the files and data sets used or created by JMP Life Sciences software, see
Files and Data Sets
.
The
Venn Diagram
process does
not
consist of a normal JMP Life Sciences
dialog
. Instead, selecting this process when a table is open and in focus opens a dialog
that instructs you to select the variables to investigate. When you select one or more variables, choose options, and click
, an interactive Venn diagram is generated.
Tip
: Refer to
Proportional Areas
for information about proportional and non-proportional diagrams.
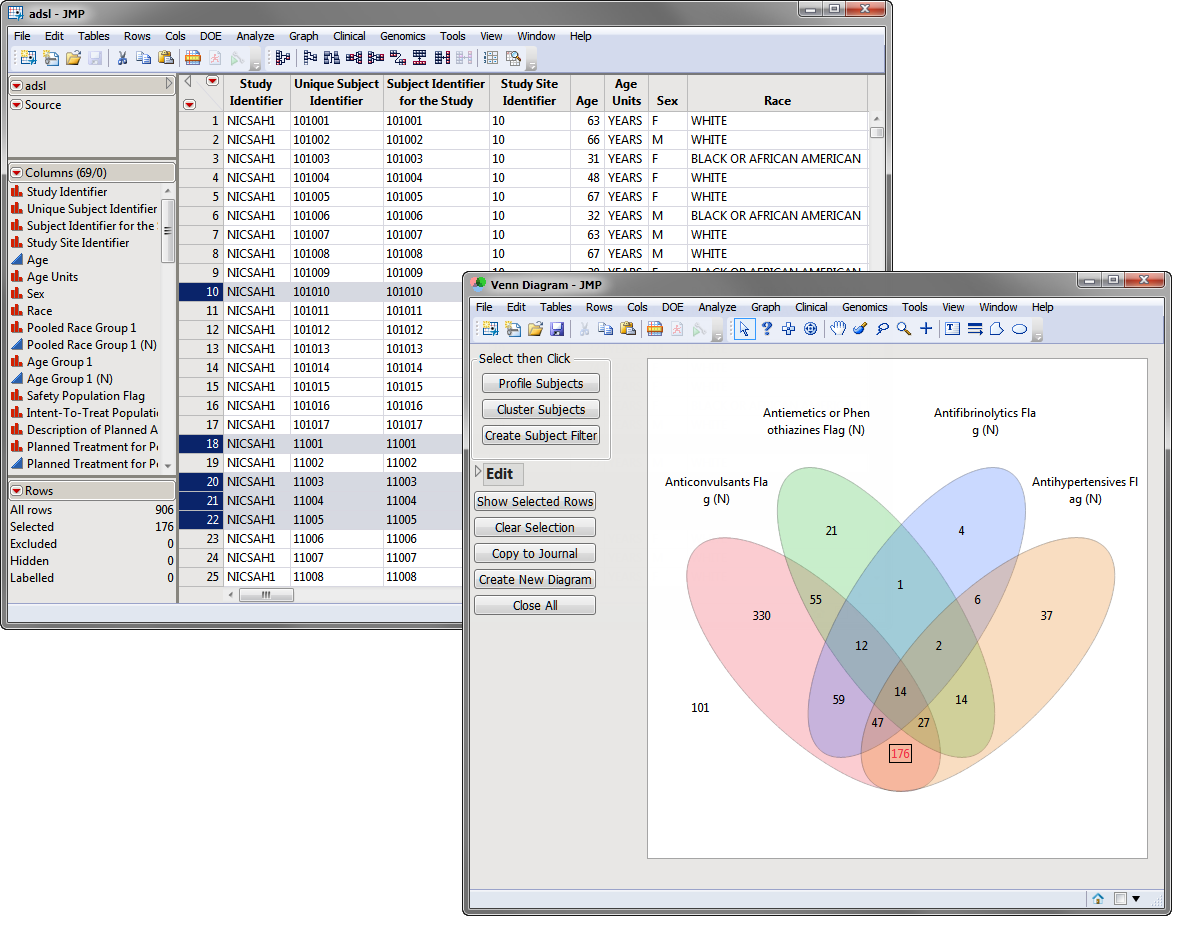
The source table is
linked
to the interactive Venn diagram. Clicking group(s) in the diagram simultaneously selects corresponding rows in the table. An example interactive Venn diagram and linked table are shown
below
. Those patients taking anticonvulsants and antihypertensives, but
not
antiemetics or antifibrinolytics, 176 in total, have been selected by clicking on that region of the diagram. This results in the automatic selection of the 176 corresponding rows.
Note
: You can further customize the analysis using the drill-down buttons located to the left of the diagrams. See
Profile Subjects
,
Create Cross Domain Data
, and
Create Subject Filter
for more details.