The
Tree Diagram
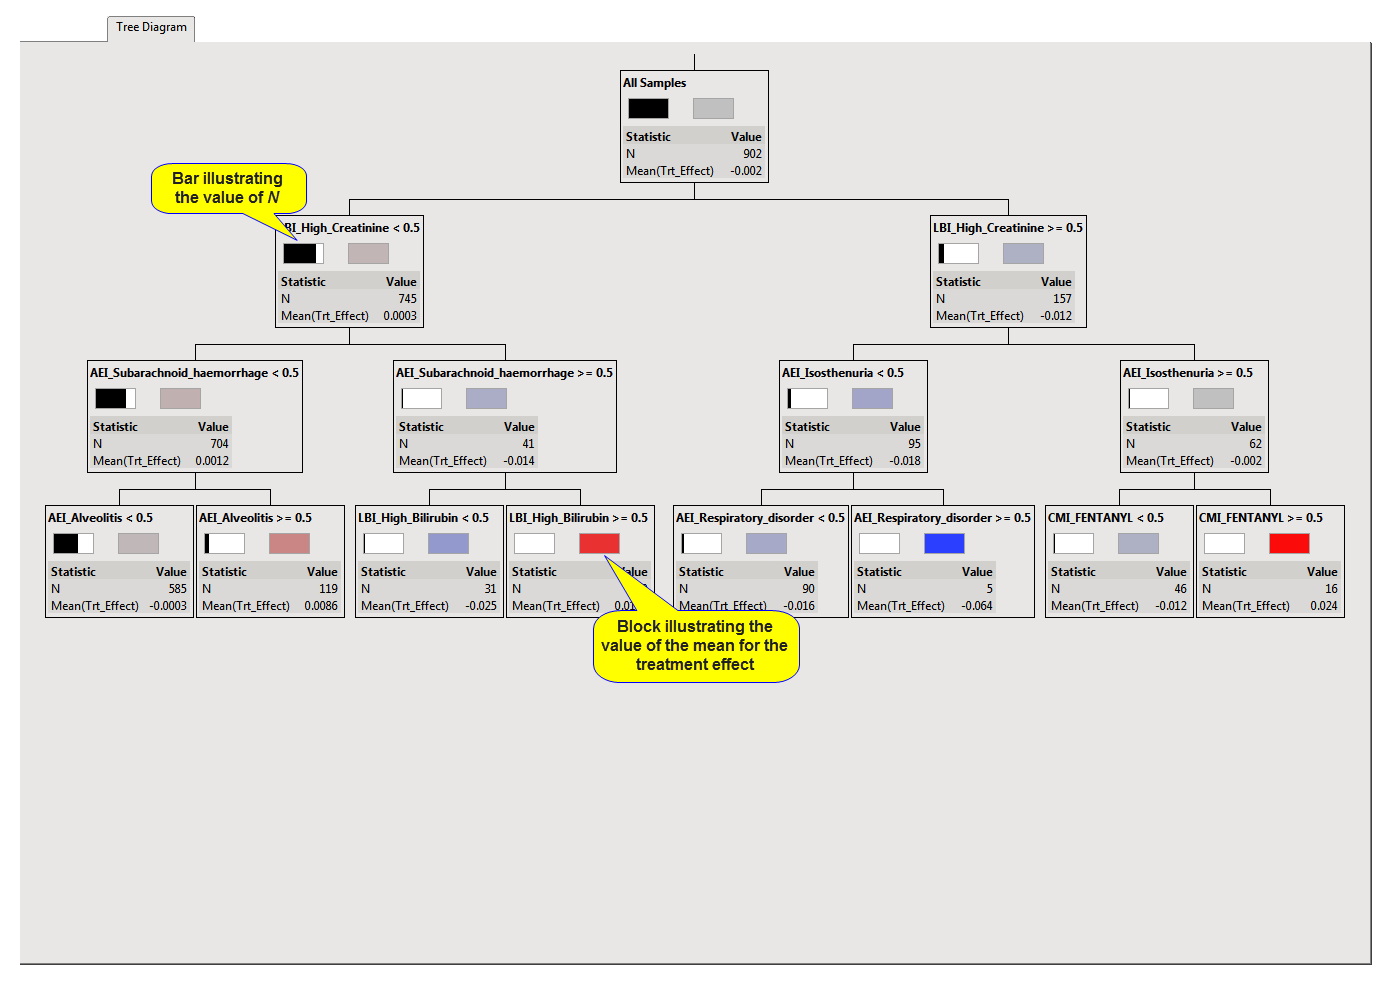
tab contains the following elements:
This shows the nodes and branches of the fitted
tree
. You can examine this display to see how predictions are determined by the tree. Note how each
leaf
contains two blocks that provide a visual representation of the relevant statistics. The width of the black bar within the left-hand block represents the number of individuals in the leaf. The color of the right-hand block represents the
mean
of the treatment effect, with the color progressing from blue through gray to red as the value of the treatment effect increases.