The
Chromosome Position Plots
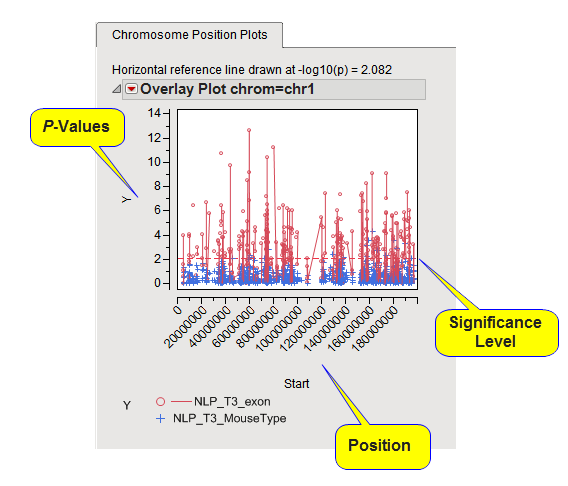
tab is shown below:
Note
: This tab is generated when a
Chromosome Variable
is specified.
The
Chromosome Position Plots
tab contains the following elements:
|
•
|
One
p
-Value Plot.
|
There is a separate plot for each
chromosome
containing one
p-value
plot when multiple chromosomes are included in the analysis. There is only one plot shown here because all of the l
probes
in this example were specific for chromosome 1.
The
Y
-axis
variable
is the meta-analysis
p
-value, converted to the
-log
or
-log
10
scale if selected in the process
dialog
. The
X
-axis plots location of the marker according to the
Position Variable
.
A horizontal reference line is drawn as a red, dashed line at the significance level that was specified. For
-log
or
-log
10
-converted
p
-values,
observations
above this line are significant; for
p
-values on the original scale, markers below the line are significant.
On this plot or any of the other
p
-value plots, simply mouse-over any of the points on the plot to see the name of the marker. When an annotation accession variable is specified when running the process, you can select a point and click on any of the Annotation action buttons to link directly to the corresponding website to view extensive annotation information about the marker.