The
MA Plots
tab is shown below:
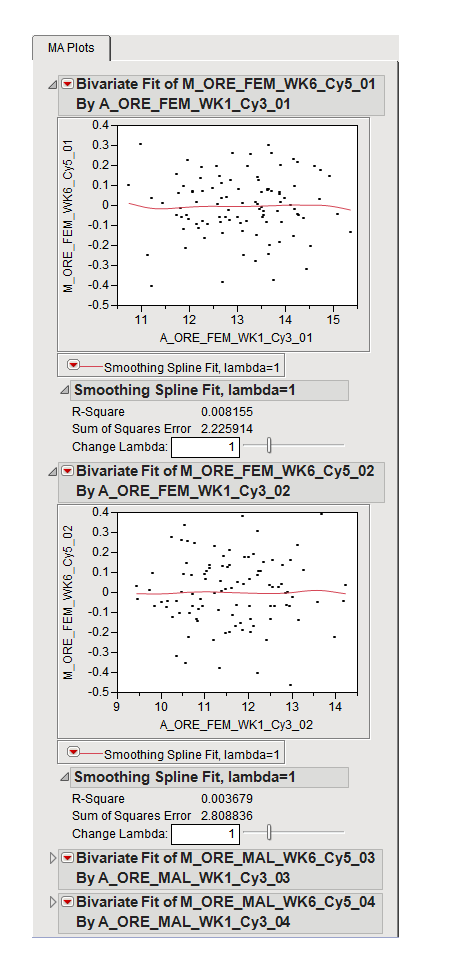
The
MA Plots
tab contains the following elements:
|
•
|
A standard assumption in
microarray
experiments is that few genes should exhibit a change in
expression
, meaning that most points on the
y
axis
should be close to
zero
(0) and the spline should be relatively flat. In this example, the points are scattered, indicating that data
normalization
is needed.