Two
Bar Chart
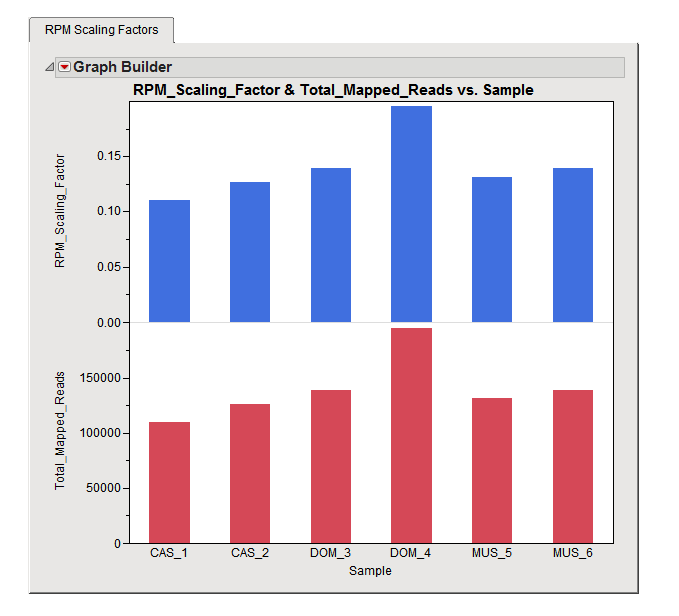
s. The first ( blue bars ,
top
) shows the scaling
factors
used for each of the samples in the studies. The second chart (red bars,
bottom
) shows the total number of mapped reads in each of the samples.
Note
: The
Total Mapped Reads
Scaling Approach
has been used in this example.