The
Surface Summary
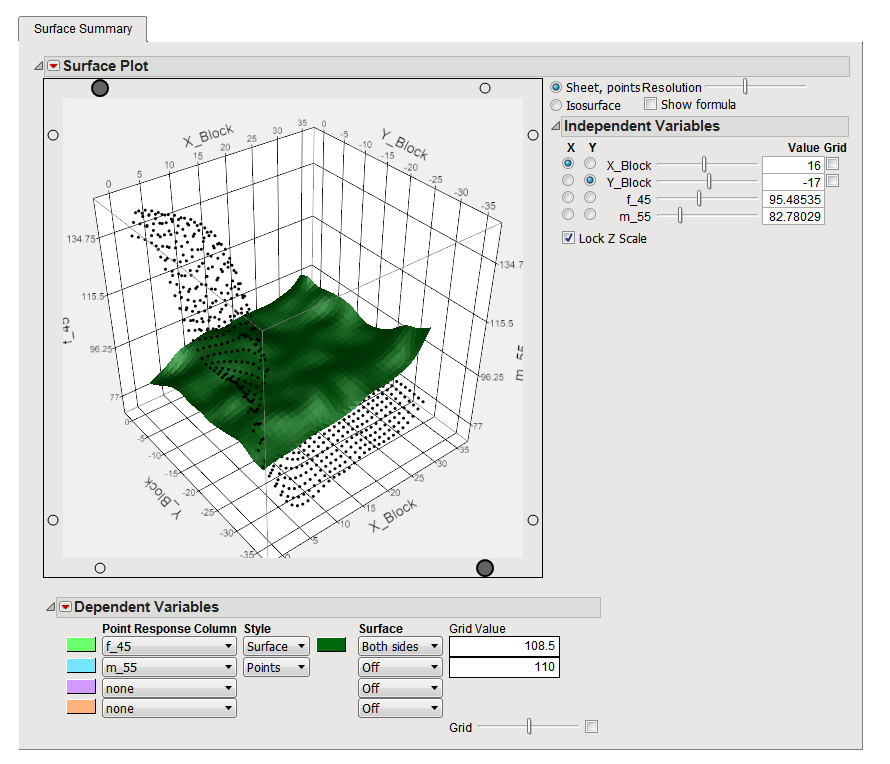
tab containing the interactive surface plots is shown below. One surface plot is generated for each of the specified
z-Coordinate Variables
.
The
Standardized Residual Plots
tab contains the following elements:
In this example, two
Z
variables
were specified from the
chips45and55.sas7bdat
input data set. The
f_45
plot is in green. The
m_55
plot is represented by black dots. Examination of the plots reveals that while the background of chip
f_45
is relatively smooth, chip
m_55
has a region of unusually high background signal
See
Surface Plot
for more information.