The
Variance Components Chart
tab is shown below:
The
Variance Components Chart
tab contains the following elements:
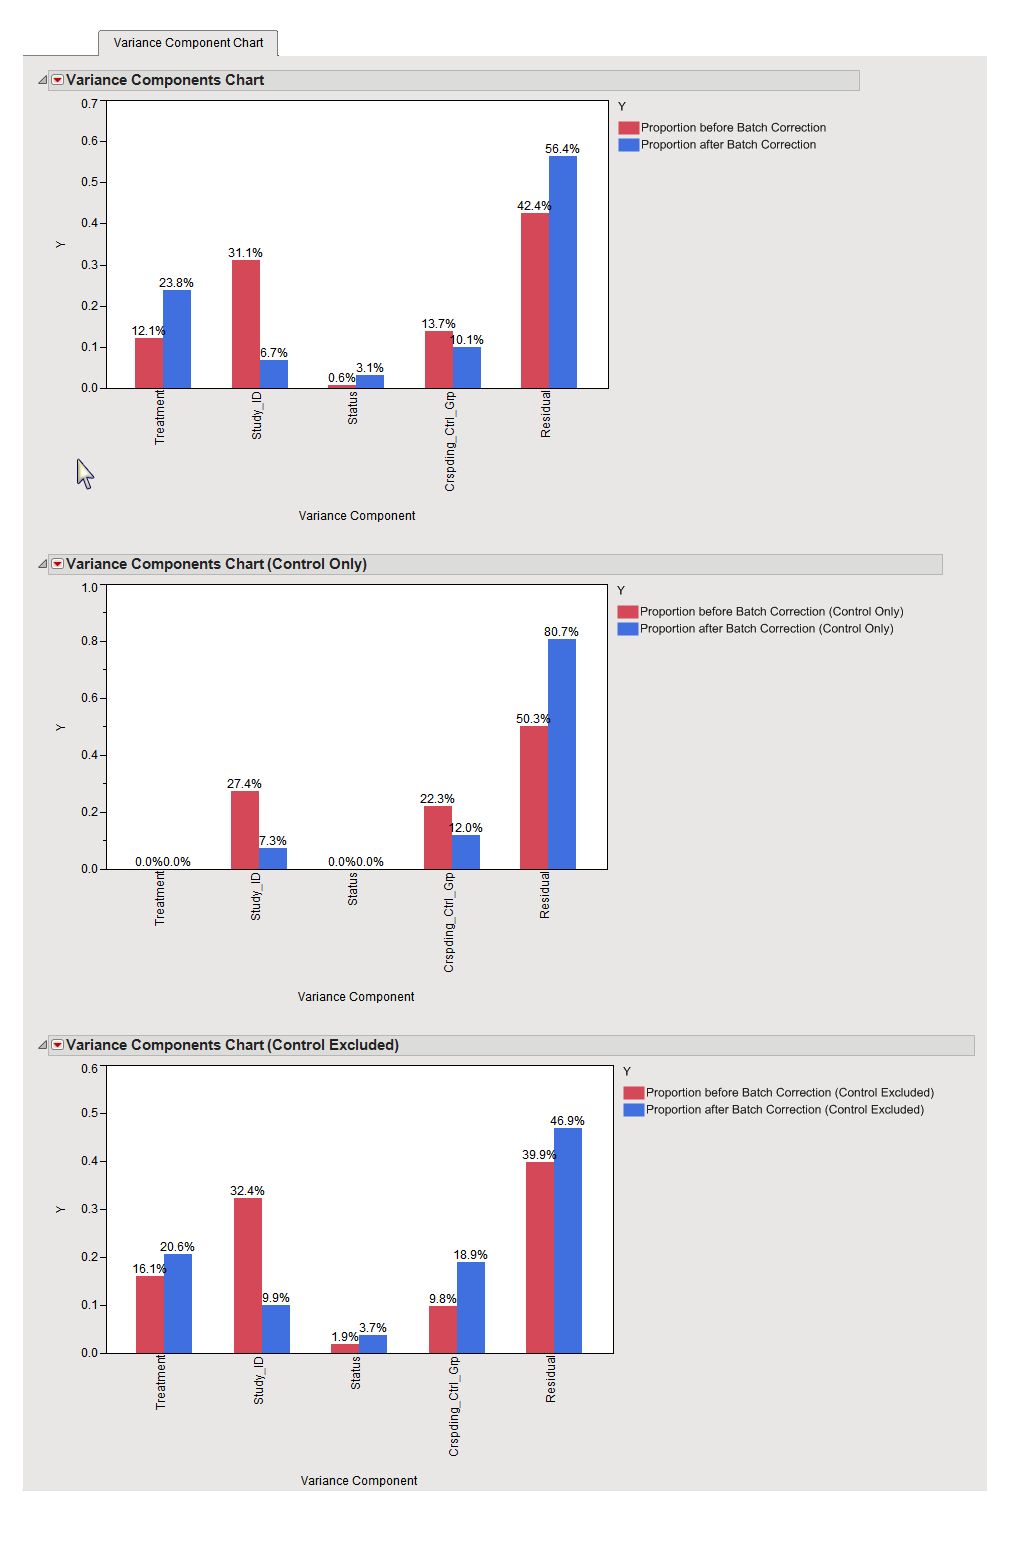
This
bar chart
provides an overall view of proportion of variability explained by all specified
variance
components before and after
normalization
. There is a separate chart for each group. This chart can reveal the major sources of variability in your experiment.