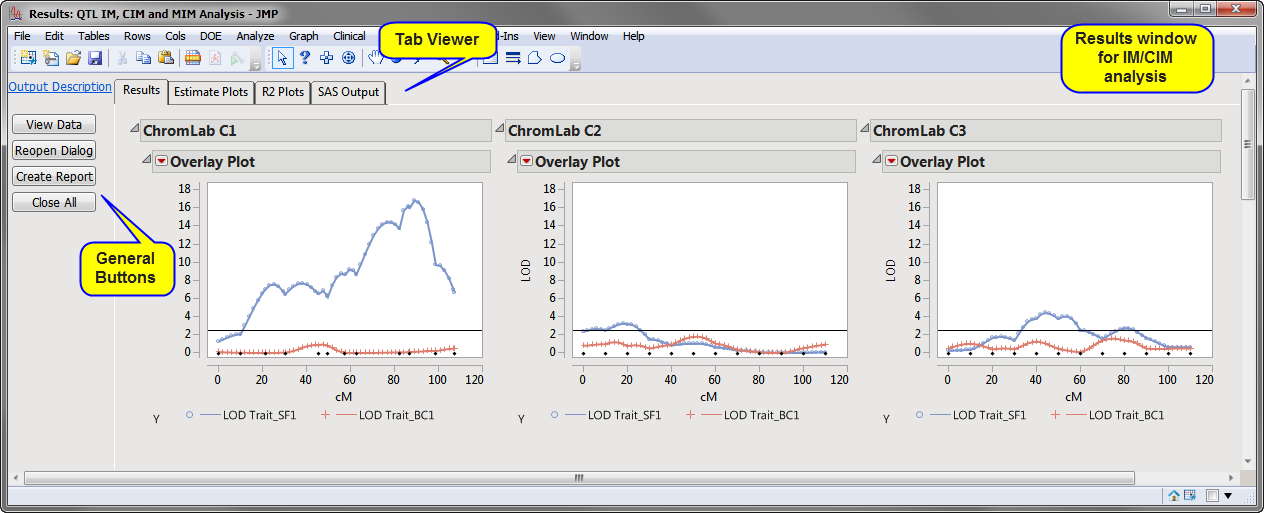
This pane provides you with a space to view individual tabs within the
Results
window. Use the tabs to access and view the output plots and associated data sets.
|
•
|
Results (IM and CIM Analysis)
: This tab includes plots for each
chromosome
(with
traits
either overlaid in a single plot or split out into separate plots) displaying the
LOD score
versus the
QTL
testing location in
centiMorgans
or Morgans.
|
|
•
|
Estimate Plots (IM and CIM Analysis)
: These plots show the
LOD
score versus the Additive Effect computed by the QTL model for each trait.
|
|
•
|
R2 Plots
: This tab includes
distributions
displaying
R
2
estimates (also called
CorrCoeff2
, the square of the
correlation coefficient
) for each QTL testing location for a trait, and, a multivariate correlation plot showing the correlations between the trait estimates.
Note
: The correlation
scatterplot
is generated only when multiple
Trait Variables
are specified.
|
|
•
|
SAS Output
: This tab displays results tables created by SAS for the QTL model.
Note
: This tab is generated only when
EM Algorithm
is chosen as the
QTL Mapping Model Algorithm
.
|
|
•
|
Click
to reveal the underlying data table associated with the current tab.
|
|
•
|
Click
to reopen the completed process dialog used to generate this output.
|
|
•
|
Click
to generate a
pdf
- or
rtf
-formatted report containing the plots and charts of selected tabs.
|
|
•
|
Click
to close all graphics windows and underlying data sets associated with the output.
|