An
Annotation Plotting Group Results
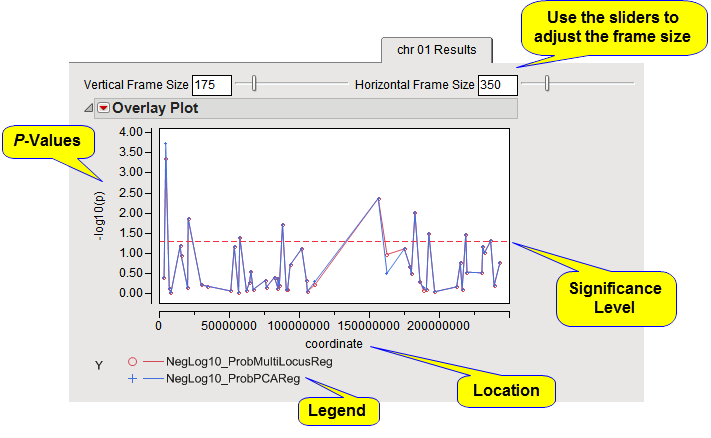
tab is shown below:
The
Annotation Plotting Group Results
tab contains the following elements:
When there are multiple annotation plotting groups, there is a separate results tab for each annotation plotting group containing one or more
p-value
plots.
The
Y
-axis
variable
is the
p
-value from the
association
tests, converted to the
-log
or
-log
10
scale if selected in the process
dialog
. The
X
-axis plots location of the gene according to the annotation location variable of the first
SNP
of the annotation analysis group within the annotation plotting group.
A horizontal reference line is drawn as a red, dashed line at the significance level that was specified. For
-log
or
-log
10
-converted
p
-values, markers above this line are significant; for
p
-values on the original scale, genes below the line are significant.
Note
: For
Multiple SNP-Trait Association
, all specified tests are included in a single plot with a legend displaying the line and point color and gene for each test. If any
BY variables
were selected, a separate chart is displayed for each
BY group
.