The
Heterogeneity Statistics
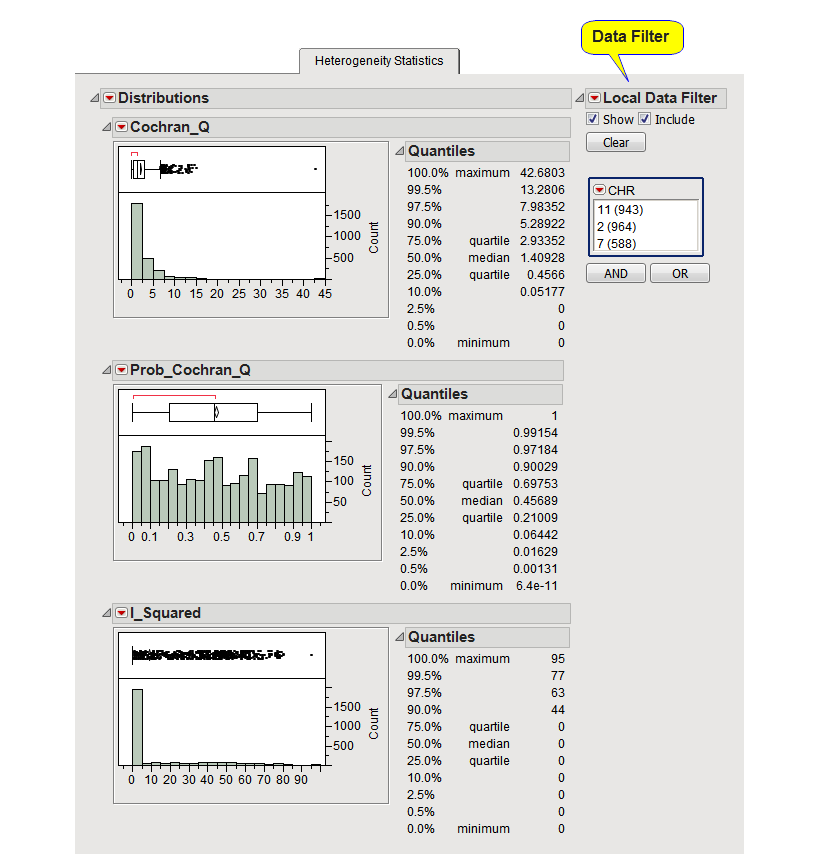
tab is shown below:
The
Heterogeneity Statistics
tab contains the following elements:
This tab displays distributions across all markers for the following heterogeneity statistics: Cochran's
Q
, the
p-value
for Cochran's
Q
, and I2 when either of the inverse
variance
methods for combining
p
-values has been selected as the
Method to Use
.
These statistics can tell you whether the fixed or
random effects
model is appropriate for combining
p
-values for a marker. Low values of Cochran's
Q
and I2 and a non-significant Cochran's
Q
p
-value indicate small amounts of heterogeneity between studies and thus a
fixed effects
model is likely appropriate. Otherwise, a random effects model should be used.
The
Local Data Filter
on the right can be used to view the distributions for a single or a subset of
chromosomes
at a time. Note however that this does not actually select markers for the drill-down buttons. Markers can be selected either by clicking on chromosomes in the legend below the plot or by selecting points in the plot using left-click with the mouse.