Output Graphics and Action Buttons | Genetics | Model Fitness Plot Single

Model Fitness Plot Single
The Model Fitness Plot Single tab is generated when the Output fitness statistics for every model check box was checked, The tab is shown below:
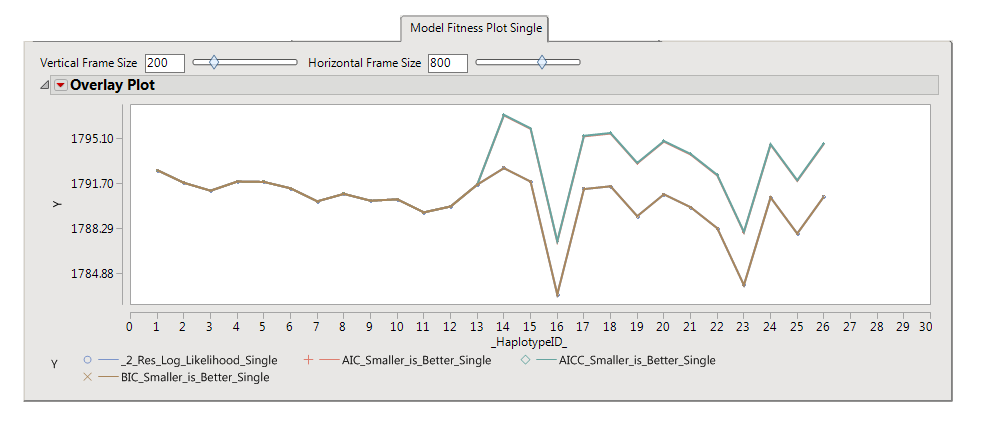
The plot shows model information criteria values for the single model on the y -axis for each window ID on the x -axis.
Model information criteria are relative measures of model fitness, and models with smaller values of information criteria are preferable. To identify the best fitting model to the current data among all evaluated models, select a model information criterion and compare its value across all models. The best model is the one with the smallest value.