The
Results
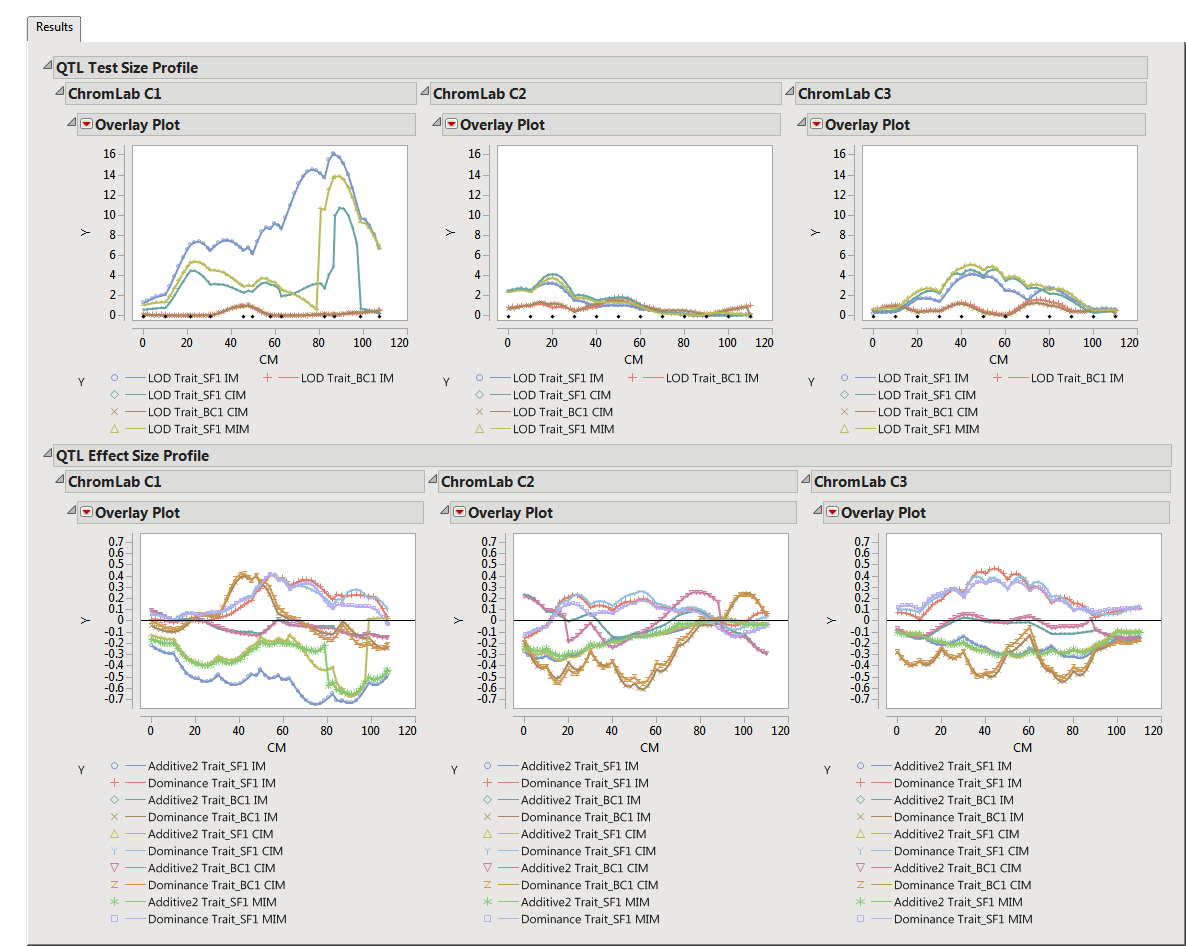
tab contains the following elements:
These plots display the
QTL
Test Size versus the QTL testing location for each
chromosome
. Black diamonds near the
x
-axis indicate the position of markers, and these are displayed when the option to
Display QTL location
has been checked.
These plots display the QTL Effect Size versus the QTL testing location for each chromosome. These plots are shown only when some
QTL Effect Size
variables are specified