The
Results
tab is shown below:
The
Results
tab contains the following elements:
|
•
|
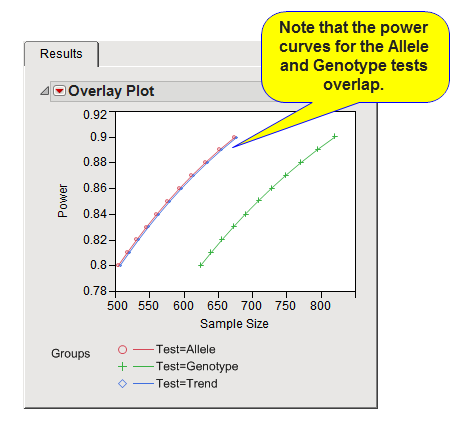
The
overlay plot
shown on this tab plots
power
on the
y
-axis versus the
sample size
required to achieve that power on the
x
-axis. Separate curves are shown for each test that was selected.
For this example shown here, because the
inbreeding coefficient
=0 (
Hardy-Weinberg equilibrium
is assumed), curves for the
Allele
and
Trend
tests have almost identical power.