Output Graphics and Action Buttons | Genetics | Summary Chart (Haplotype Estimation)

Summary Chart (Haplotype Estimation)
The Summary Chart 
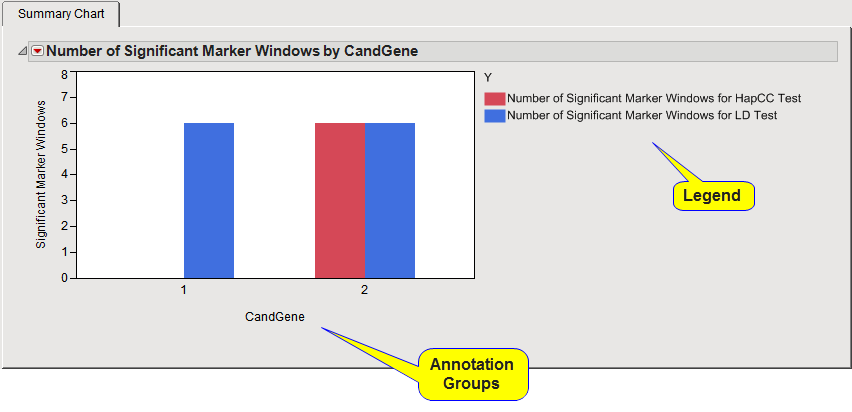
tab (shown below) gives an overview of the counts of significant markers for each test in each annotation group.
There is a separate set of bars for each annotation group, with individual bars for each test performed and a legend showing the color used for each test if there is more than one.
If a binary trait variable was selected, the HapCC test represents the overall marker window test for different haplotype frequencies between the two values of the trait variable. The LD test tests for overall LD across all markers in the window.
If any BY variables were selected, a separate chart is displayed for each BY group .
This chart can be used to determine what Annotation Group Results tab to open and further explore, particularly when a large number of windows were tested.