The
Volcano Plot Single
tab is shown below:
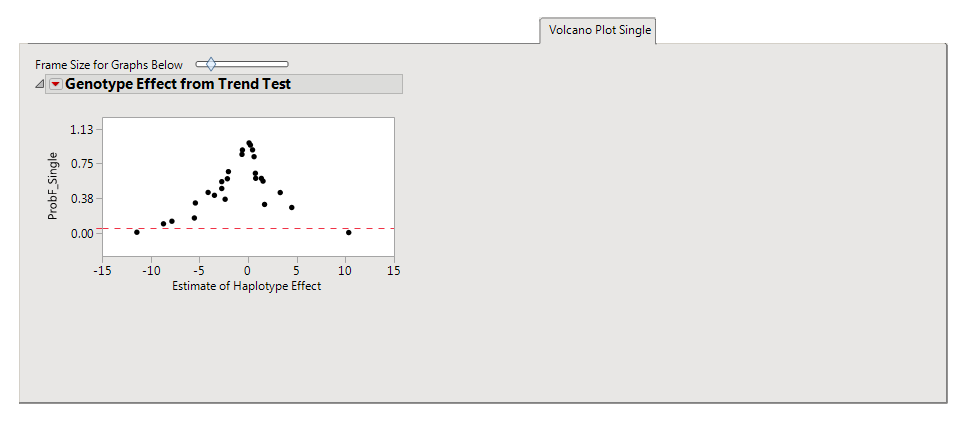
This tab shows scatter plot of
p
-values on the
y
-axis for each
Estimate of Haplotype Effect
on the
x
-axis.
Smaller values of
p
-values indicate stronger association between the tested haplotype in the single model and the trait.