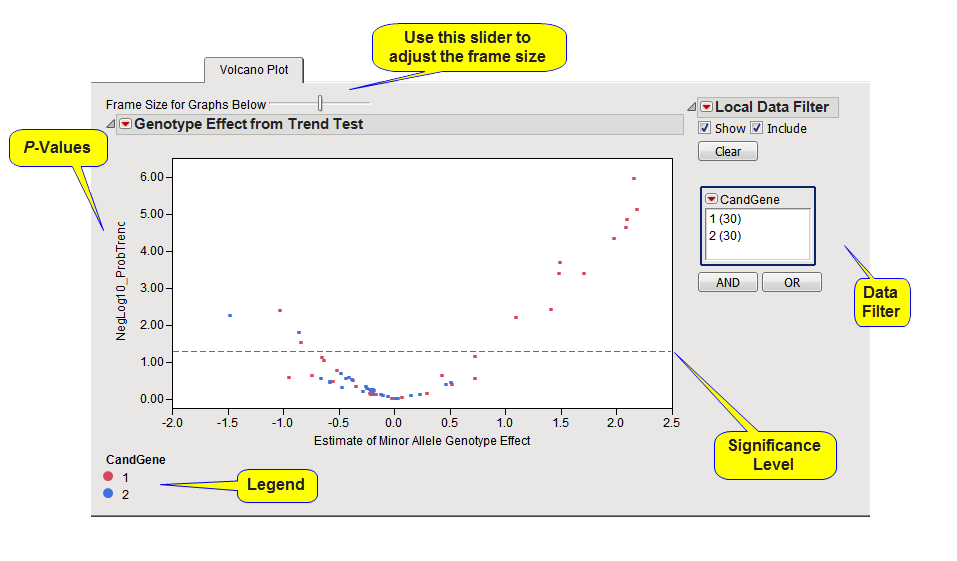
When the Trend test is performed, a scatter plot shows the
p-values
and estimates of minor
allele
genotype
effect for the Trend test, for all annotation groups. The
y
-axis
variable
of this scatter plot is the
p
-value from the trend test, converted to the
-log
or
-log
10
scale if selected in the process
dialog
. The
x
-axis plots the estimate of the
minor allele
genotype effect for each marker. When the
traits
is binary, this is the same value as the
log odds
ratio, so this plot is identical to the Odds Ratio Volcano Plots (shown on the
All P-Value Plots
tab)with all annotation groups overlaid onto a single plot. When the trait is continuous, this is the fixed effect estimate for the genotype variable in the trend test (treating genotype as a continuous variable). A positive value on the
x
-axis indicates a positive correlation of the number of
minor alleles
for that marker's genotype with the trait.
When the Genotype test is performed and the
Output genotype LS means and diffs
check box is checked (not done in this example), this tab will contain two more
volcano plots
displaying the
p
-value versus the estimate for the LS diff between genotypes 0 and 1, and genotypes 0 and 2. The
y
-axis variable of this scatter plot is the
p
-value for the LS diff, converted to the
-log
or
-log
10
scale if selected in the process dialog. The
x
-axis plots the estimate of the LS diff for each marker.
For all volcano plots, a horizontal reference line is drawn as a red, dashed line at the significance level that was specified. For
-log-
or
-log
10
-converted p-values, markers above this line are significant; for
p
-values on the original scale, markers below the line are significant.
The
Local Data Filter
to the right of the plot can be used to display a single annotation group at a time. Note however that this does not actually select markers for the drill-down buttons. Markers can be selected either by clicking on annotation groups in the legend below the plot or by selecting points in the plot using left-click with the mouse. If any
BY variables
were selected, a separate set of plots is displayed for each
BY group
.