The
P-ValuePlots of Test I
tab is shown below:
The
P-ValuePlots of Test I
tab contains the following elements:
|
•
|
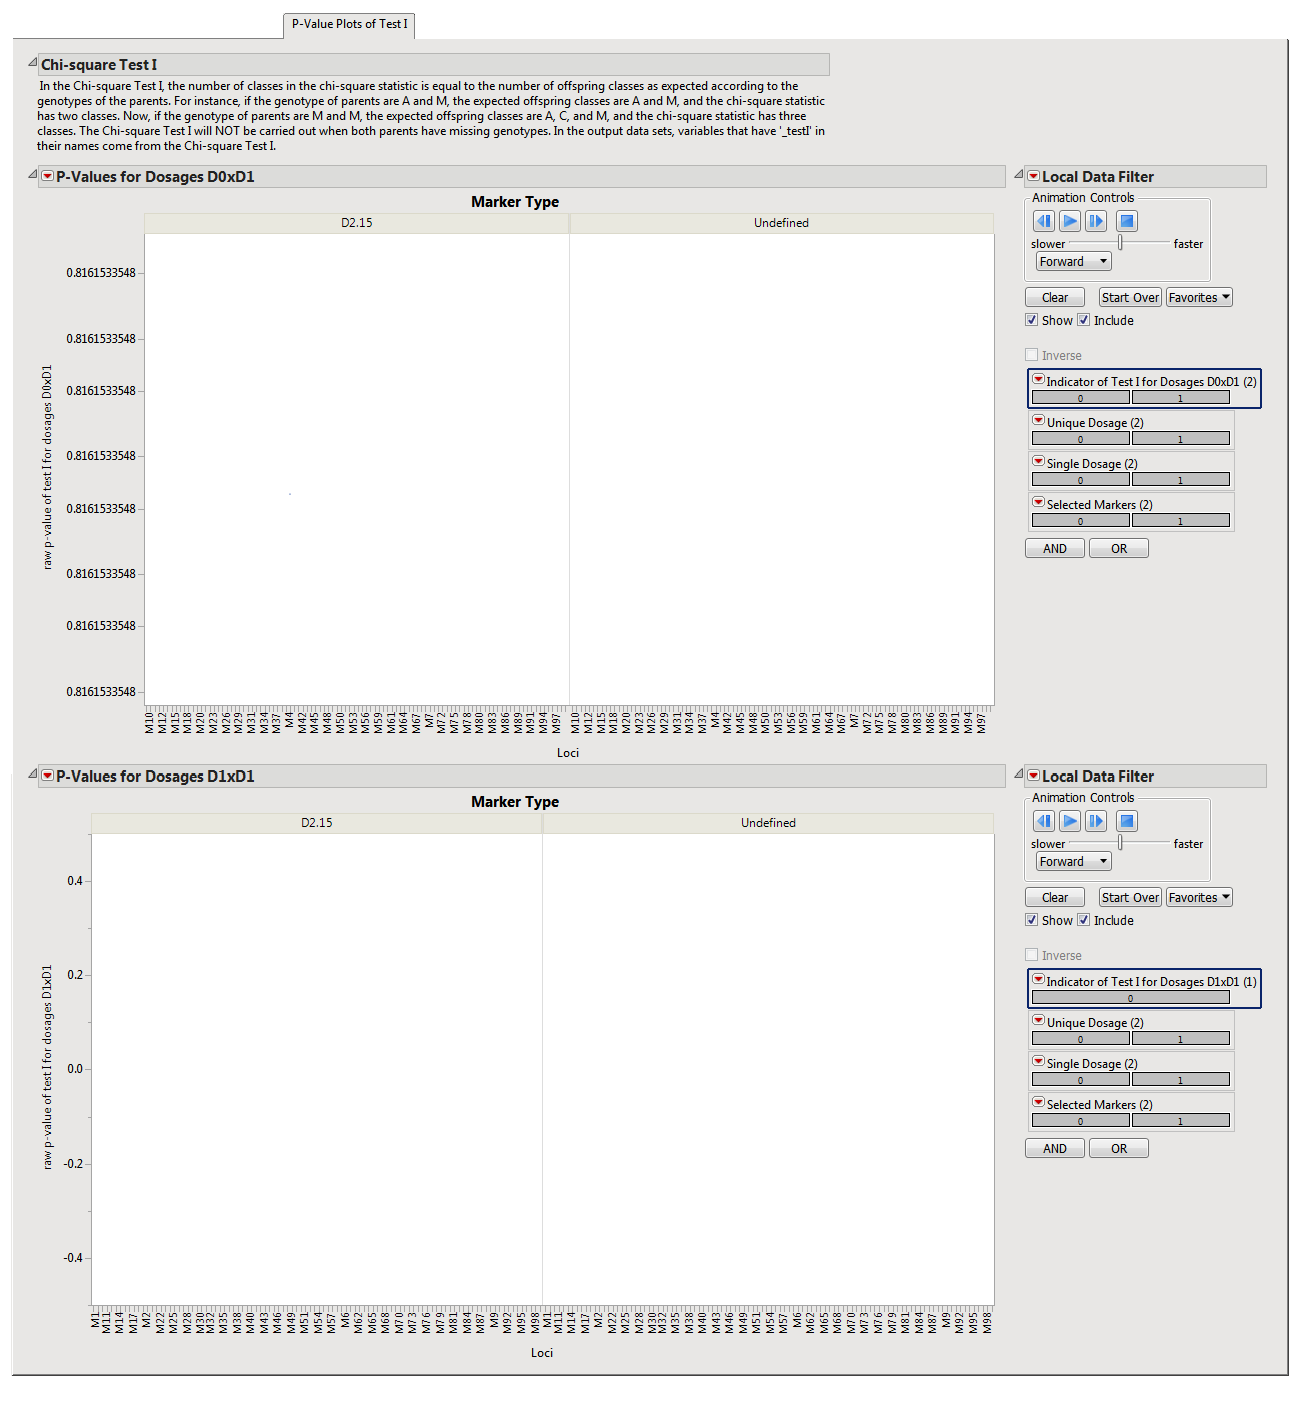
Chi-square Test I
: This is a text message describing the
chi-square
Test I.
|
|
•
|
P-Values for Dosages DjxDk
: These plots show the raw
p-values
of the
Chi
-square Test I for dosages
Dj
and
Dk
, where,
j
represents the
allele
dosage in one parent, and
k
represents the allele dosage in the other parent.
|