Plots
genotype
distributions
and
Box Plot
s of selected markers for each of the Trait Variable values.
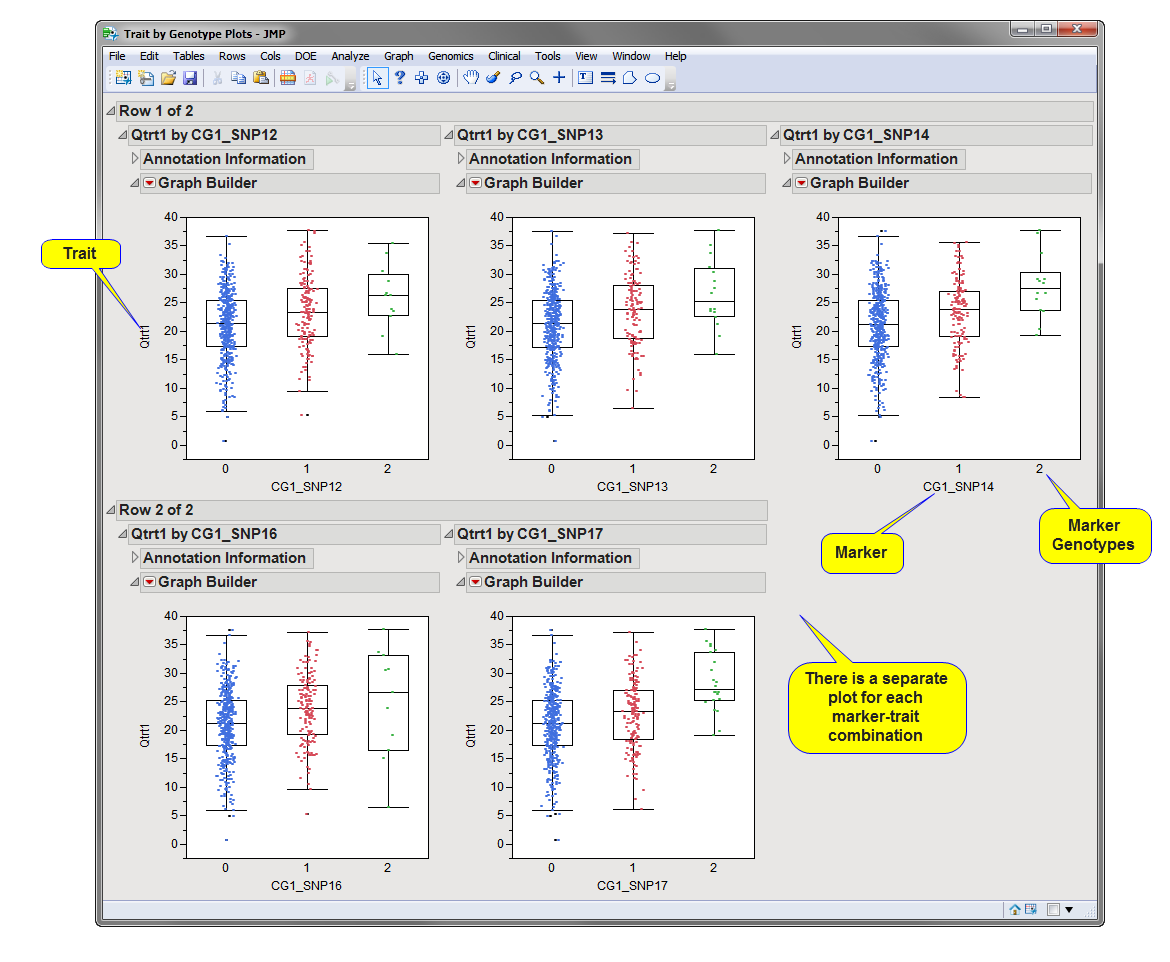
Plots genotype distributions and Box Plot s of selected markers for each of the Trait Variable values.