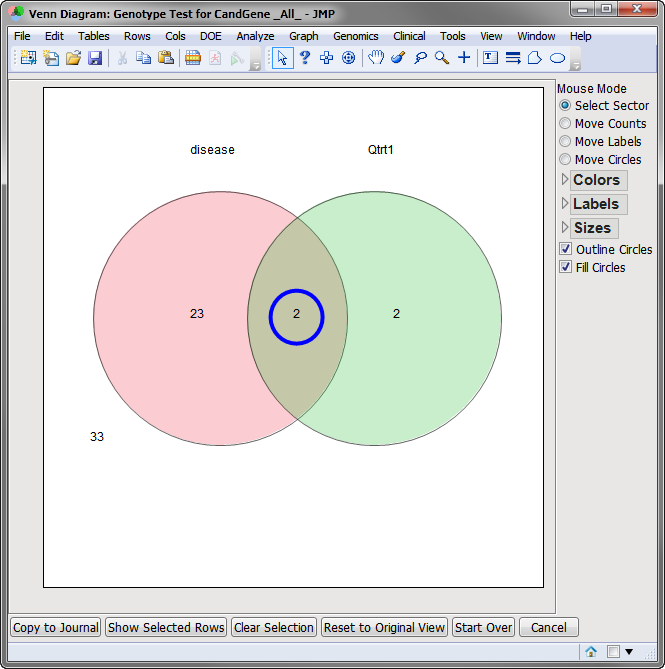
Output Graphics and Action Buttons | Action Buttons | View Venn Diagram of Significant Markers by Trait for the Test Below

View Venn Diagram of Significant Markers by Trait for the Test Below
Generates a Venn diagram of markers with significant association as determined by either the Genotype or Trend association test for the traits , so you can easily identify what markers are significant for one or more traits.
In the example shown below, 25 markers are significantly associated with disease susceptibility, 4 markers are significantly associated with quantitative trait 1 and 2 (circled) are significantly associated with both, as determined by the Genotype test.