The
Results
tab is shown below:
The
Results
tab contains the following elements:
|
•
|
A
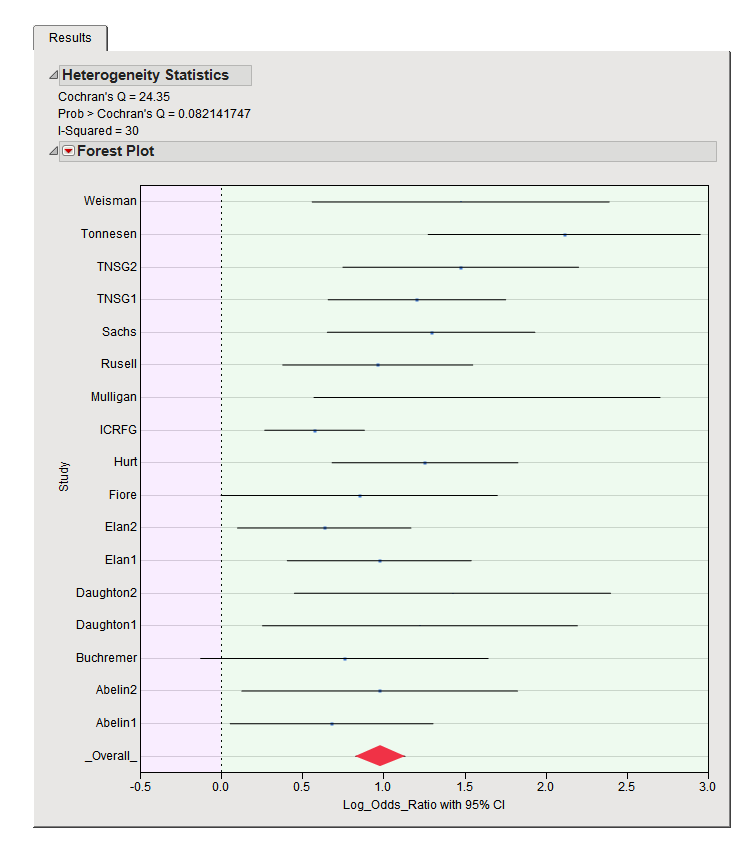
Heterogeneity Statistics
table
|
The values of the heterogeneity statistics, Cochran's
Q
, the
p-value
for Cochran's
Q
, and
I
2
, are displayed, which can be used to indicate whether a
fixed effects
or
random effects
model
is appropriate. See
Heterogeneity Statistics
for additional details.
This plot shows the effect estimate (
regression
coefficient or
log odds
ratio) for each individual study along with its confidence interval. The weight for the study (in this case, the inverse of the effect estimate's
variance
) is represented by the size of the square. A red diamond is centered at the overall estimate with width extending the length of the estimate's confidence interval.