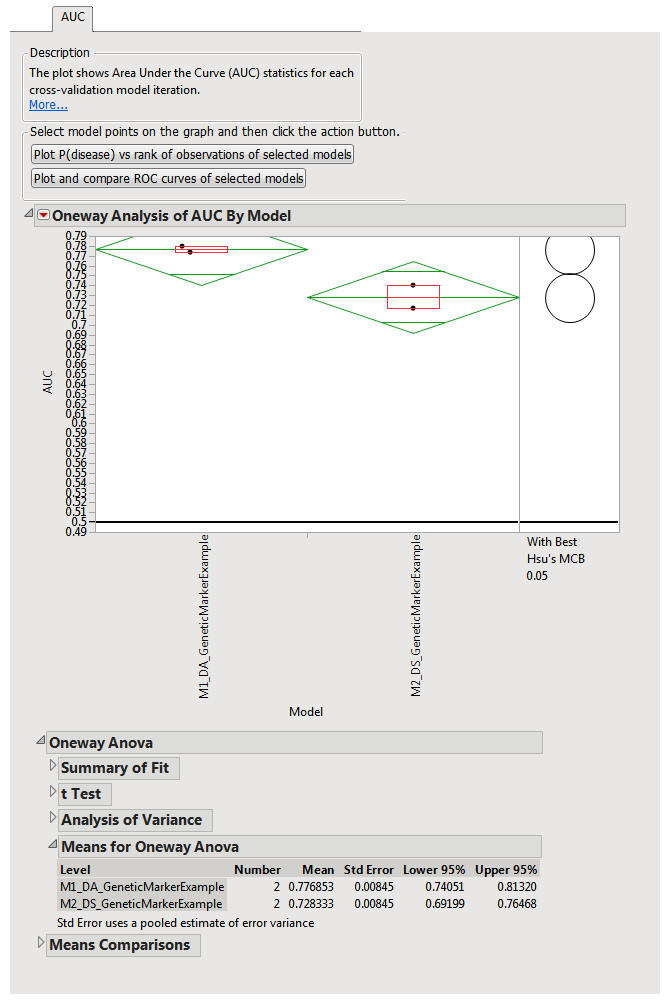
The plot shows Area Under the Curve ((
AUC
) statistics for each
cross validation
model iteration. AUC is the area under the Receiver Operating Characteristics (
ROC
) curve, which plots
sensitivity
versus
1 -
Specificity
for predictions of a binary response
variable
. The solid black horizontal reference line is the
median
among cross validation iteration of the AUC values estimated without any
model
. The dashed horizontal reference lines above and below the solid one are the levels of the whiskers in a
box plot
for these no-model estimates. The AUC depends on which response value is designated as the event. Usually, the least frequent value is the event. For such cases, the better the model the larger the AUC, and a model whose cross validated AUC is near or below this baseline range is unreliable and should be ignored. The plots use the Mann-Whitney statistic to compute the AUC.
The output of this tab is similar to the
RMSE
tab, and contains the following additional element:
|
•
|
button
|
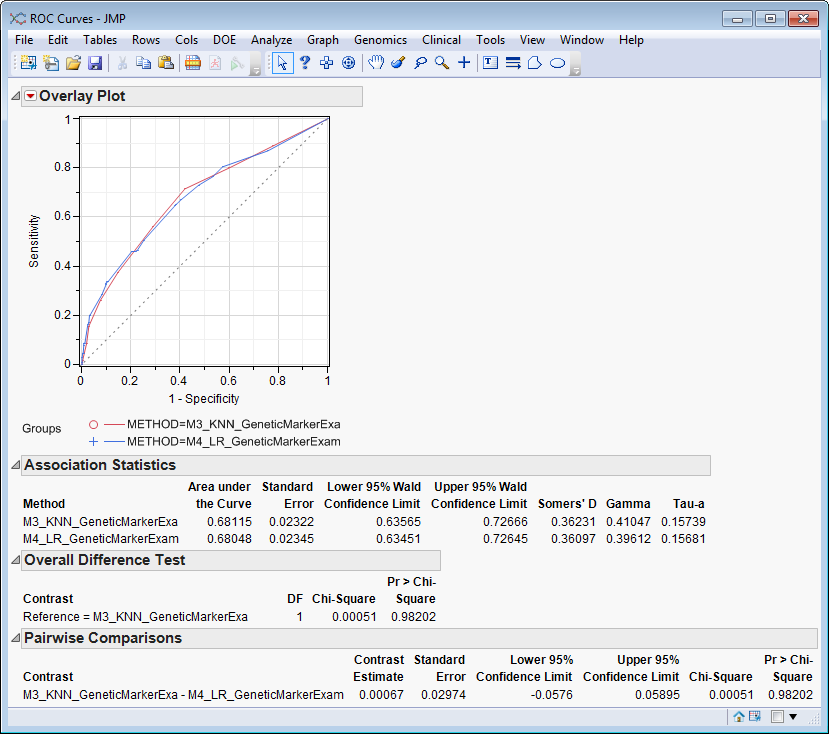
This is a comparison of ROC curves for each of the methods. The area under each curve is the AUC statistic plotted in the oneway plot. AUC is a measure of sorting efficiency, with a value of
1
indicating perfect sorting and
0.5
random sorting. ROC curves that approach the upper left corner of the plot indicate better performance. See
Receiver Operating Characteristics (ROC) Curves
for more information.