The
Plot of Mass ...
tab is shown below:
The
Plot of Mass by Time
tab contains the following element:
|
•
|
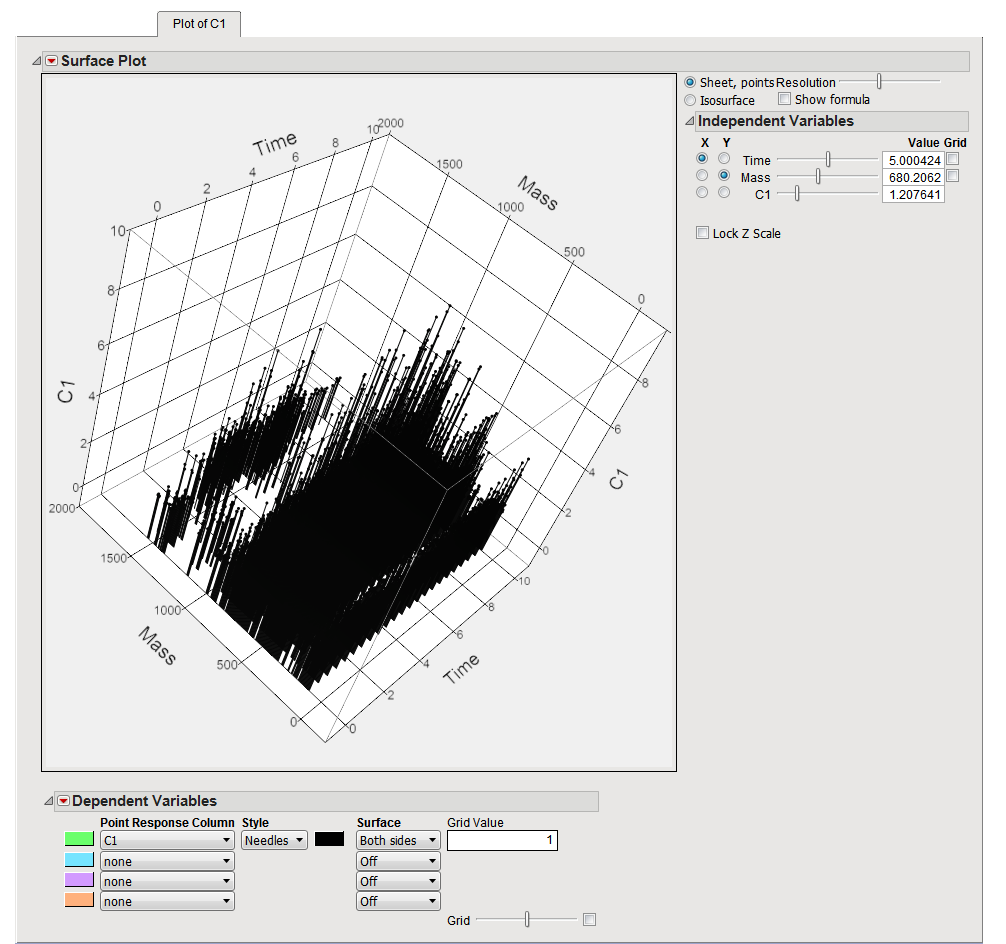
One
surface plot
.
|