Running this process using the
LungCancerExample
sample setting generates the tabbed
Results
window shown below. Refer to the
Batch Normalization
process description for more information. Output from the process is organized into tabs. Each tab contains one or more plots, data panels, data filters, and so on. that facilitate your analysis.
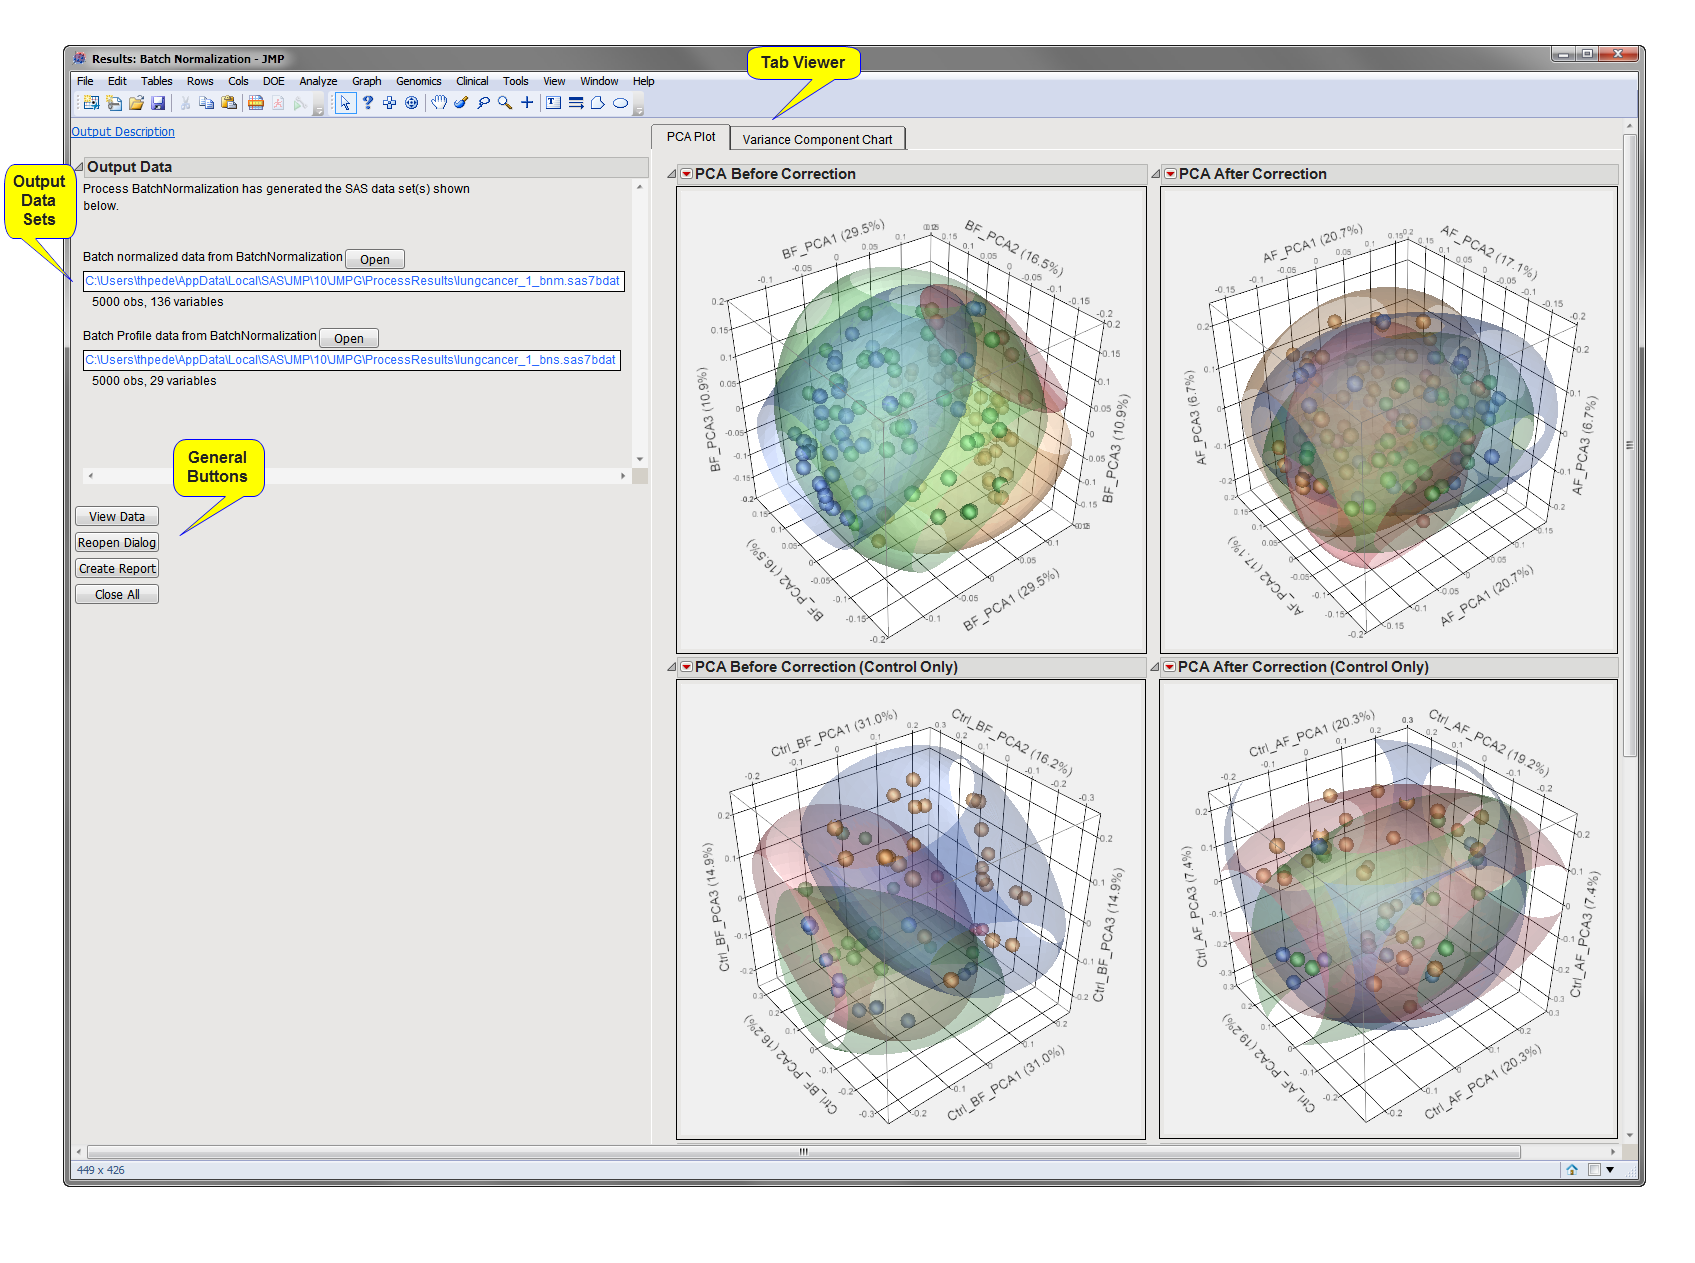
The
Results
window contains the following panes:
This pane provides you with a space to view individual tabs within the
Results
window. Use the tabs to access and view the output plots and associated data sets.
|
•
|
PCA Plot
: This tab shows an interactive three-dimensional
scatterplot
of
principal components
for each batch before and after
normalization
.
|
|
•
|
Variance Components Chart (Batch Normalization)
: This tab shows
bar charts
illustrating principal
variance
components for each batch.
|
|
•
|
Batch Normalized Output Data Set
: This output data set contains the batch normalized data. This data set is indicated by the
_bnm
suffix. Click
to view the data set.
|
|
•
|
Batch Profile Output Data Set
: This data set (indicated by the
_bns
suffix) provides the parameters used for normalizing the data in the input data set. These parameters can also be used for normalizing data
from subsequent studies
and for estimating an updated batch profile
.
Click
to view the data set.
|
For detailed information about the files and data sets used or created by JMP Life Sciences software, see
Files and Data Sets
.
|
•
|
Click
to surface the data sets corresponding to the active tab.
|
|
•
|
Click
to reopen the completed process dialog used to generate this output.
|
|
•
|
Click
Create Report to generate a
pdf
- or
rtf
-formatted report containing the plots and charts of selected tabs.
|
|
•
|
Click
Close All to close all graphics windows and underlying data sets associated with the output.
|