Running this process for the
pseudo_rna
sample setting generates one filtered output data set accessed from a
Results
window shown below. Refer to the
Allele Specific Expression Filter
process description for more information about this process.
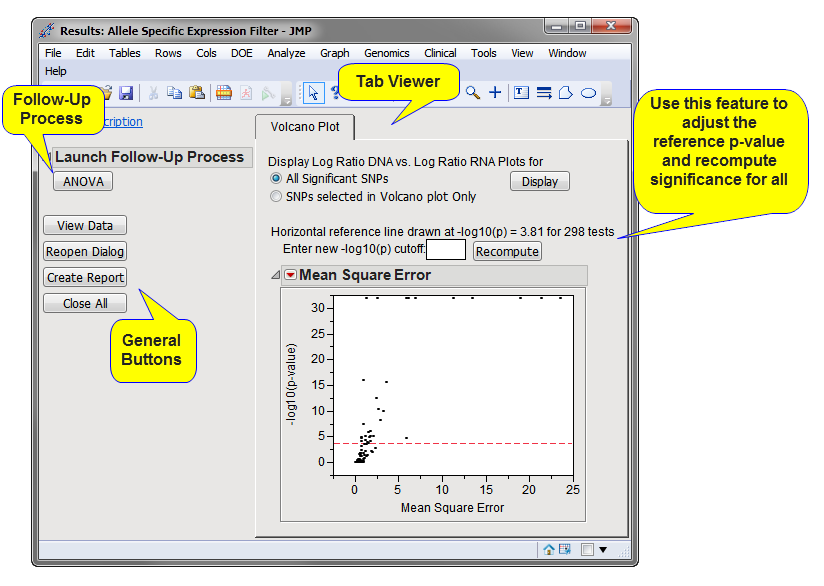
The
Results
window contains the following panes:
This pane provides you with a space to view individual tabs within the
Results
window. Use the tabs to access and view the output plots and associated data sets.
|
•
|
The output data set (identified by the appended
_asf
suffix) corresponding to this plot can be accessed by selecting
.
Log Ratio DNA versus Log Ratio
RNA
Plots
, either for selected SNPs or all significant SNPs, can be displayed using the
button. A representative example of two of the plots is shown below.
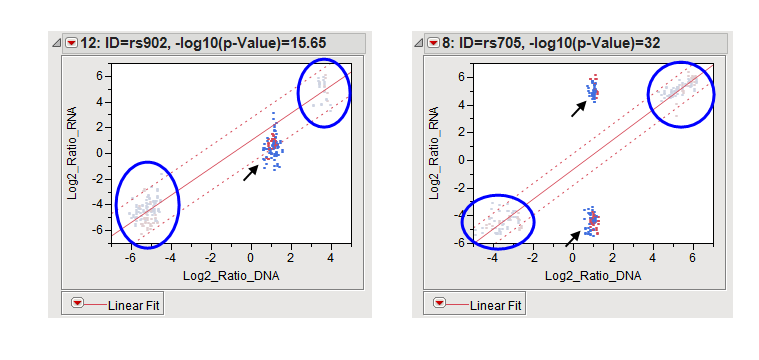
Each plot in the Log Ratio Plots represents an individual
locus
. Homozygotes for the two
alleles
in each plot are circled, heterozygotes are indicated by black arrows. The red solid lines represent the fitted
regression
lines for homozygotes. The dashed lines to either side represent the 95% confidence bands.
The plot on the left shows that for this SNP, heterozygotes cluster within or close to the regression line and show ratios that are intermediate between the homozygotes. This indicates a lack of allele-specific
expression
.
Finally, the
-log
10
p-value
reference can be adjusted and the significance recomputed for all tests.
|
•
|
Click
to surface the data sets corresponding to the active tab.
|
|
•
|
Click
to reopen the completed process dialog used to generate this output.
|
|
•
|
Click
Create Report to generate a
pdf
- or
rtf
-formatted report containing the plots and charts of selected tabs.
|
|
•
|
Click
to close all graphics windows and underlying data sets associated with the output.
|