Running this process for the
GeneticMarkerExample
sample setting generates the tabbed
Results
window shown below. Refer to the
LD tagSNP Selection
process description for more information. Output from the process is organized into tabs. Each tab contains one or more plots, data panels, data filters, and so on. that facilitate your analysis.
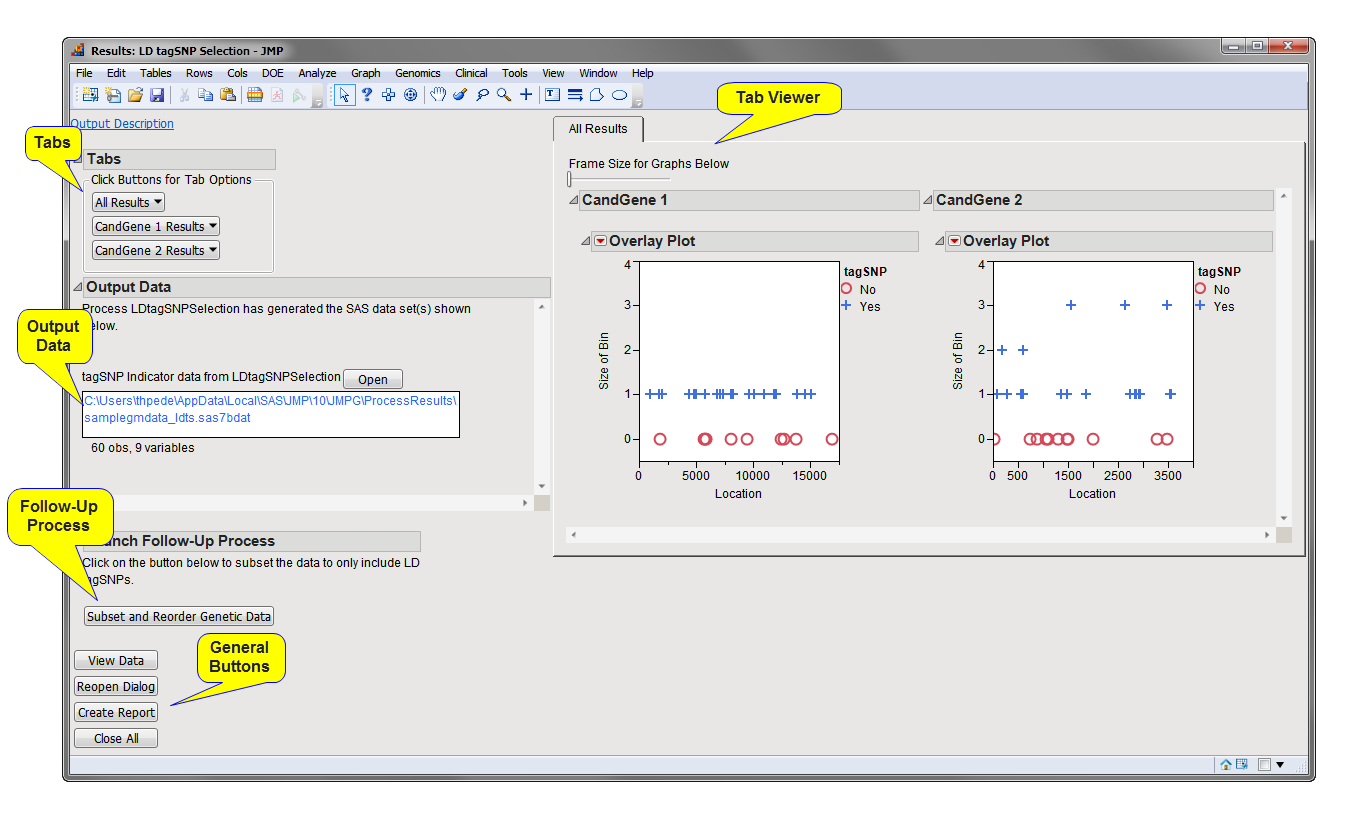
The
Results
window contains the following panes:
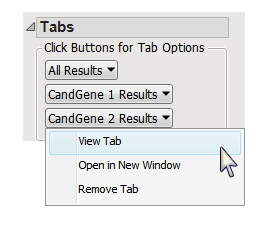
This pane enables you to access and view the output plots and associated data sets on each tab. Use the drop-down menu to view the tab in the
Tab Viewer
pane, open the tab in a new window, or remove the tab and its contents from the
Tab Viewer
pane.
|
•
|
All Results
: This tab displays a plot with
SNP
locations along the
x
-axis and a separate plot for each annotation group, if selected. Each SNP is either given a blue plus symbol or a red circle indicating whether it has been selected as
tag SNP
or not, respectively.
|
|
•
|
Annotation Group Results
: When an annotation group
variable
has been selected, this tab displays a plot, or set of plots if any By Variables, like that described above for the given annotation group.
|
|
•
|
GenBank Nucleotide
: Select points or rows and click
to opens a browser window directed to a GenBank Nucleotide search for the selected molecular entities.
|
|
•
|
UniGene Database
: Select points or rows and click
to access information from the Unigene database for selected genes or markers
|
|
•
|
AceView Database
: Select points or rows and click
to access information from the ACEView database for selected genes or markers.
|
|
•
|
dbSNP
: Select points or rows and click
to open a browser window directed to an NCBI dbSNP search for the pair of SNPs associated with the particular instance of this button.
|
|
•
|
tagSNP Indicator Data Set
: When the
Create tagSNP subset indicator variable
check box has been checked, this data set contains the variables from the
annotation data set
along with variables indicating what
bin
, if any, each SNP has been assigned to, the size of the bin, a variable indicating whether the SNP is a
tagSNP
for the bin, and an indicator for including that SNP in a subset. This last variable randomly selects a tagSNP from each bin if there are more than one tagSNPs for the bin, so that the SNPs with a value of 1 in that column can be used as a subset of SNPs representing the data. The button described below can be used to automatically create this subset.
|
For detailed information about the files and data sets used or created by JMP Life Sciences software, see
Files and Data Sets
.
|
•
|
: Click to launch and run the
Subset and Reorder Genetic Data
process using the same input data set as for
LD tagSNP Selection
and the
tagSNP Indicator
data set as the annotation data set preloaded as input, with
tagSNPSubset = 1
entered in the
Filter to Include Markers
field, to create subset data sets only including the selected tagSNPs.
|
|
•
|
Click
to reveal the underlying data table associated with the current tab.
|
|
•
|
Click
to reopen the completed process dialog used to generate this output.
|
|
•
|
Click
to generate a
pdf
- or
rtf
-formatted report containing the plots and charts of selected tabs.
|
|
•
|
Click
to close all graphics windows and underlying data sets associated with the output.
|