Running this process using the
GeneticMarkerExample
sample setting generates the tabbed
Results
window shown below. Refer to the
SNP-Trait Association
process description for more information. Output from the process is organized into tabs. Each tab contains one or more plots, data panels, data filters, and so on. that facilitate your analysis.
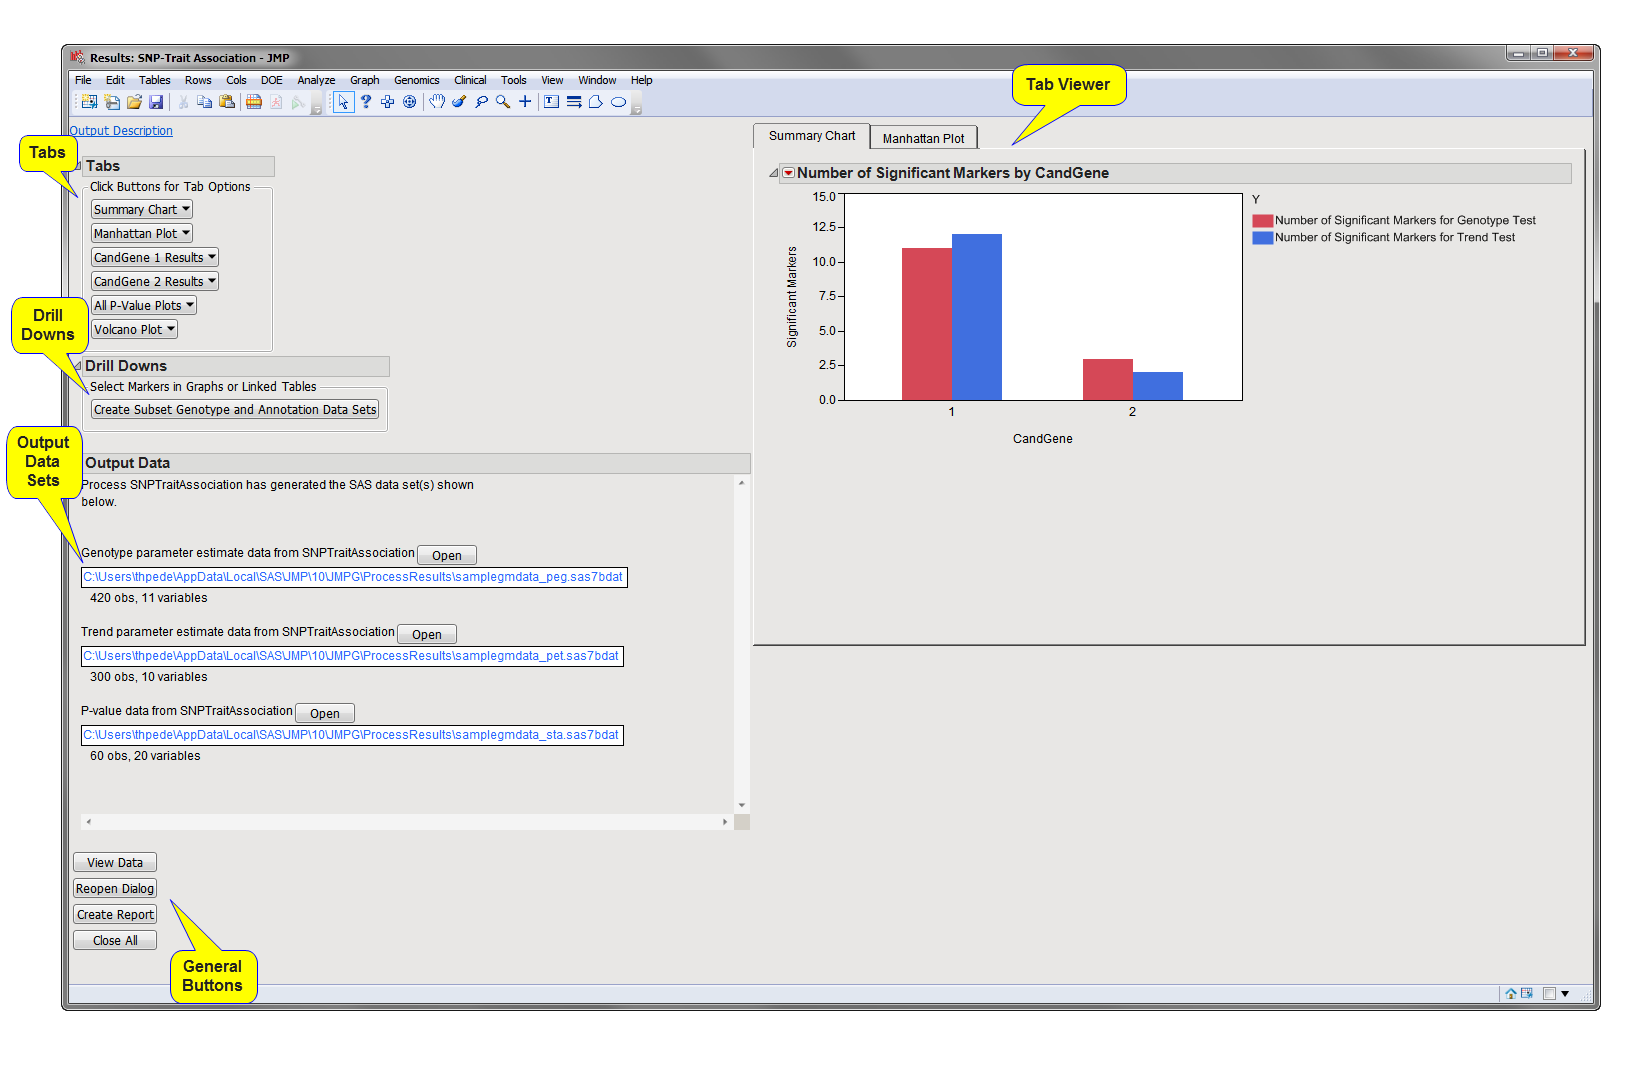
The
Results
window contains the following panes:
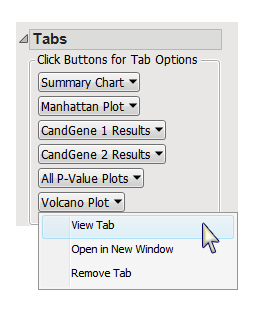
This pane enables you to access and view the output plots and associated data sets on each tab. Use the drop-down menu to view the tab in the
Tab Viewer
pane, open the tab in a new window, or remove the tab and its contents from the
Tab Viewer
pane.
|
•
|
Summary Chart
: When there are multiple annotation groups (
chromosomes
or genes, for example), this tab displays the number of significant markers in each annotation group for each test. Separate
bar charts
are shown for each
BY group
when any
BY variables
are specified. This tab is open by default.
|
|
•
|
Manhattan Plot
: When there are multiple annotation groups (chromosomes or genes, for example), this tab displays a scatter plot of the
p-values
across all annotation groups.
|
|
•
|
Annotation Group Results
: When there are multiple annotation groups (chromosomes or genes, for example), a separate
Results
tab with an
overlay plot
of
p
-value by chromosome location is created for each annotation group. If the
Calculate trend odds ratios
check box was checked, this tab also contains a
Volcano Plot
of
p
-value by
log odds
ratio for all markers.
|
In this example, there are two annotation groups (CandGene 1, and CandGene 2) and, thus two Annotation Group Results tabs (
CandGene 1 Results
and
CandGene 2 Results
).
|
•
|
All P-Value Plots
: When there are multiple annotation groups (chromosomes or genes, for example), the
All P-Value Plots
tab shows all the
p
-value plots from the
Annotation Group Results
tabs in a single display.
|
Note
: When an annotation group
variable
is not specified or there is only one annotation group, the tab is named
P-Value Plot
and contains an overlay plot of
p
-value by chromosome location for all markers.
|
•
|
All Trends Odds Ratio Plots
: : If the
Calculate trend odds ratios
check box was checked and there are multiple annotation groups (chromosomes or genes, for example), this tab shows all the odds ratio
volcano plots
.
|
|
•
|
Volcano Plot(s)
: This tab displays a scatter plot of
p
-value by the Estimate of Minor Allele Genotype Effect for all markers, colored by Annotation Group, when the trend test is performed. When the
Output genotype LS means and diffs
check box is checked, this tab includes scatter plots of
p
-value by the LS diffs between
genotypes
0 and 1, and genotypes 0 and 2.
|
|
•
|
Create Subset Genotype and Annotation Data Sets
: Select points from the
p
-value plots and click
to open the
Subset and Reorder Genetic Data
process to create the subset data sets.
|
Note
: This action button is not available if any By Variables are selected.
|
•
|
GenBank Nucleotide
: Select points or rows and click
to opens a browser window directed to a GenBank Nucleotide search for the selected molecular entities.
|
|
•
|
UniGene Database
: Select points or rows and click
to access information from the Unigene database for selected genes or markers
|
|
•
|
AceView Database
: Select points or rows and click
to access information from the ACEView database for selected genes or markers.
|
|
•
|
|
•
|
Plot Trait by Genotype
: Select markers from the
p
-value plots and click
to view each marker's genotype
distribution
for each of the
Trait Variables
values.
|
Note
: This action button is available only when numeric genotypes are specified.
|
•
|
View Venn Diagram of Significant Markers by Trait for the Test Below
: Click either
or
to view a
Venn diagram
showing significant
association
between markers and multiple
traits
as determined by the specific association test.
|
Note
: This option is available only when two or more
Trait Variables
are specified.
|
•
|
Select Markers in Graphs or Linked Tables, then Click to View Survival Curves
: Select the desired points/rows from either a
p
-value, a
Manhattan Plot
, or a volcano plot and then click either
or
to view the
Survival Curves
for each of the selected points as determined by the specific association test.
|
Note
: This option is available only when
Survival
is specified as the
Type of Trait
and the
Output survival function estimates for viewing survival curves
check box is checked.
|
•
|
Genotype Residual Data Set
: This data set contains input data set merged with columns of
residuals
from each genotype test
model
(each SNP, for example) and is generated when the
Genotype
test is performed and the
Output residuals from every model
check box is checked. The name of this data is set is given by the
Output File Prefix
, or input data set name if none given, with the suffix
_org
. Click
to view the data set.
|
|
•
|
Genotype LSMeans and Differences Data Set
: This data set contains the
LS means
and diffs estimates and associated statistics for each
regression
model and is generated when the
Output genotype LS means and diffs
check box is checked. The name of this data is set is given by the
Output File Prefix
, or input data set name if none given, with the suffix
_lsm
. Click
to view the data set.
|
|
•
|
Genotype Parameter Estimate Data Set
: This data set contains the estimates and
test statistics
for the
fixed effects
included in each regression model testing for association, including the marker genotype treated as a categorical variable, and is generated when the
Genotype
test is performed. The name of this data is set is given by the
Output File Prefix
, or input data set name if none given, with the suffix
_peg
. Click
to view the data set.
|
|
•
|
Genotype Covariance Parameter Estimate Data Set
: This data set contains the estimates for the
covariance
parameters (
random effects
) included in each regression model testing for association, including the residual. This data set is generated when the
Genotype
test is performed and random effects are specified. The name of this data is set is given by the
Output File Prefix
, or input data set name if none given, with the suffix
_cpg
. Click
to view the data set.
|
|
•
|
Genotype Survival Function Data Set
: This data set contains the survival function estimates for each individual from each model (each SNP, for example). This data set is used for plotting the
survival curves
with the
Genotype
action button when one or markers are selected from the
p
-value or volcano plots. This data set is generated when the
Genotype
test is performed with a survival trait and the
Output survival function estimates for viewing survival curves
check box is checked. The name of this data is set is given by the
Output File Prefix
, or input data set name if none given, with the suffix
_sfg
. Click
to view the data set.
|
|
•
|
Trend Residual Data Set
: This data set contains input data set merged with columns of residuals from each trend test model (each SNP, for example). This data set is generated when the
Trend
test is performed. The name of this data is set is given by the
Output File Prefix
, or input data set name if none given, with the suffix
_ort
. Click
to view the data set.
|
|
•
|
Trend Parameter Estimate Data Set
: This data set contains the estimates and test statistics for the fixed effects included in each regression model testing for association, including the numeric marker genotype treated as a continuous variable, and is generated when the
Trend
test is performed. The name of this data is set is given by the
Output File Prefix
, or input data set name if none given, with the suffix
_pet
. Click
to view the data set.
|
|
•
|
Trend Covariance Parameter Estimate Data Set
: This data set contains the estimates for the
covariance
parameters (random effects) included in each regression model testing for association, including the residual. This data set is generated when the
Trend
test is performed and random effects are specified. The name of this data is set is given by the
Output File Prefix
, or input data set name if none given, with the suffix
_cpt
. Click
to view the data set.
|
|
•
|
Trend Survival Function Data Set
: This data set contains the survival function estimates for each individual from each model (each SNP, for example). This data set is used for plotting the survival curves with the
Trend
action button when one or markers are selected from the
p
-value or volcano plots. This data set is generated when the
Trend
test is performed with a survival trait and the
Output survival function estimates for viewing survival curves
check box is checked. The name of this data is set is given by the
Output File Prefix
, or input data set name if none given, with the suffix
_sfa
. Click
to view the data set.
|
|
•
|
P
-value Data Set: This data set contains all the columns from the
annotation data set
, plus the test statistics and
p
-values from the tests performed. This data set can be used as the annotation data set for subsequent processes to accumulate results from multiple processes into a single data set. The name of this data is set is given by the
Output File Prefix
, or input data set name if none given, with the suffix
_sta
. Click
to view the data set.
|
For detailed information about the files and data sets used or created by JMP Life Sciences software, see
Files and Data Sets
.
|
•
|
Click
to reveal the underlying data table associated with the current tab.
|
|
•
|
Click
to reopen the completed process dialog used to generate this output.
|
|
•
|
Click
to generate a
pdf
- or
rtf
-formatted report containing the plots and charts of selected tabs.
|
|
•
|
Click
to close all graphics windows and underlying data sets associated with the output.
|