Running this process for the
comparemapexample
setting generates the tabbed
Results
window shown below. Refer to the
Compare QTL Plots
process description for more information. Output from the process is organized into tabs. Each tab contains one or more plots, data panels, data filters, and so on, that facilitate your analysis.
This pane provides you with a space to view individual tabs within the
Results
window. Use the tabs to access and view the output plots and associated data sets.
|
•
|
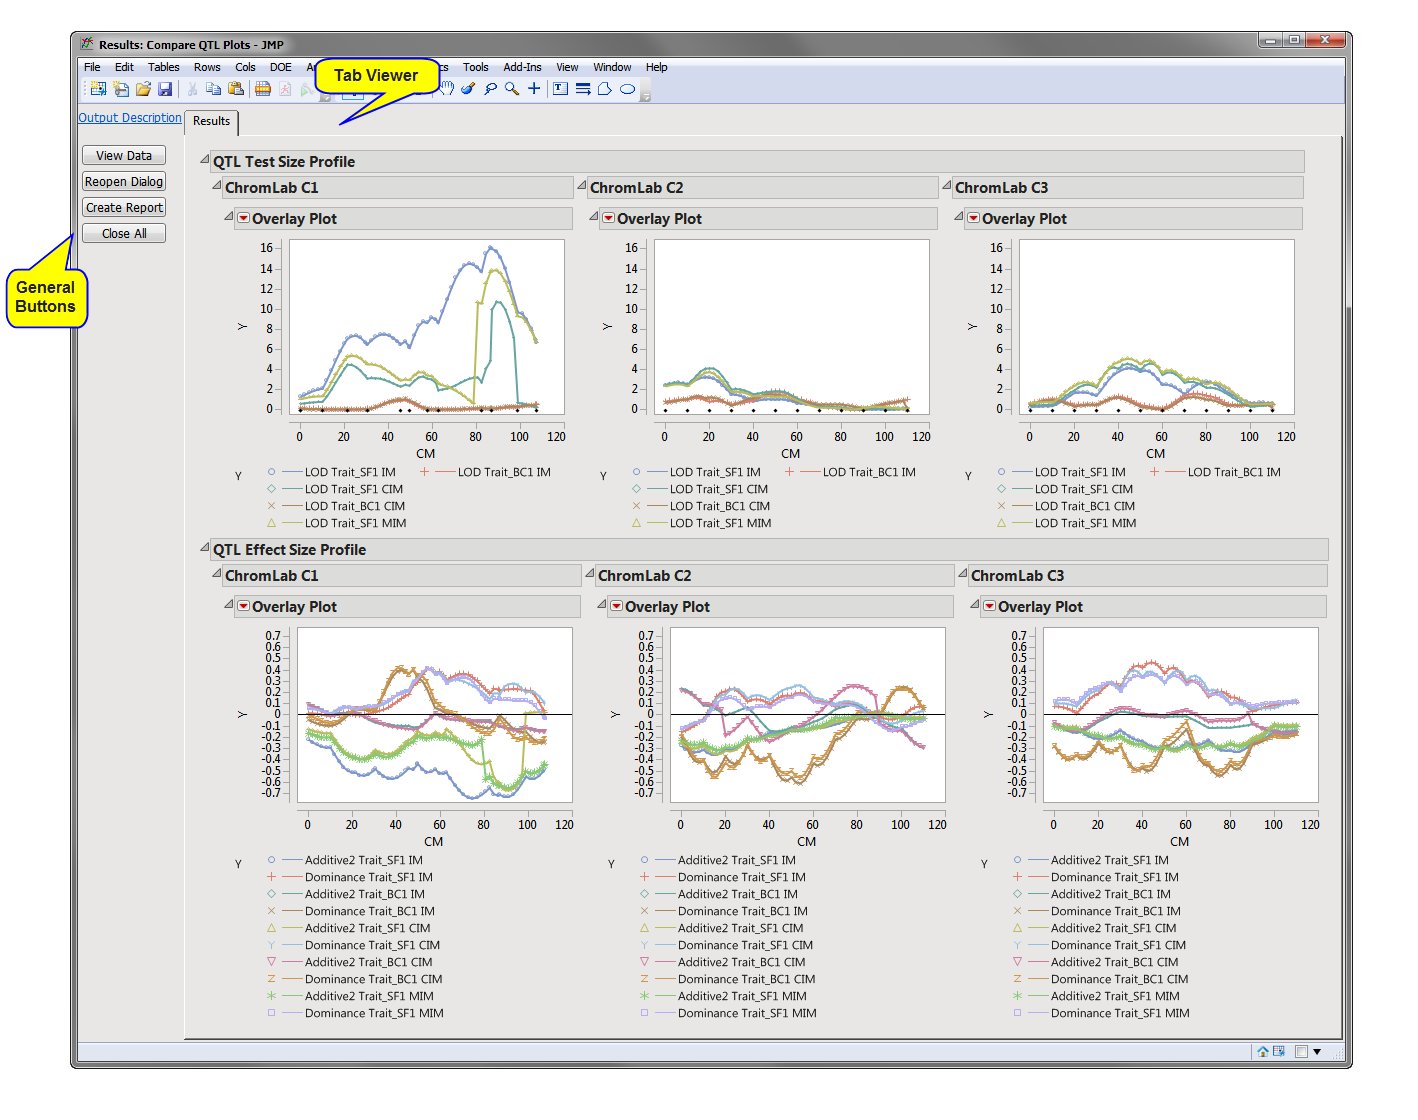
Results (Compare QTL Plots)
: This tab includes plots for each
chromosome
displaying the
QTL
Test Size
variables
overlaid in single plots versus the QTL testing location. If QTL Effect Size variables are also specified from either the General or Merge Data Sets tabs, additional plots for each chromosome displaying the QTL Effect Size variables overlaid in single plots versus the QTL testing location are displayed.
|
|
•
|
Click
to reveal the underlying data table associated with the current tab.
|
|
•
|
Click
to reopen the completed process dialog used to generate this output.
|
|
•
|
Click
to generate a
pdf
- or
rtf
-formatted report containing the plots and charts of selected tabs.
|
|
•
|
Click
to close all graphics windows and underlying data sets associated with the output.
|