Running this process for the
DrosophilaAgingExample
sample setting generates the tabbed
Results
window shown below. Refer to the
Distance Matrix and Clustering
process description for more information. Output from the process is organized into tabs. Each tab contains one or more plots, data panels, data filters, and so on, that facilitate your analysis.
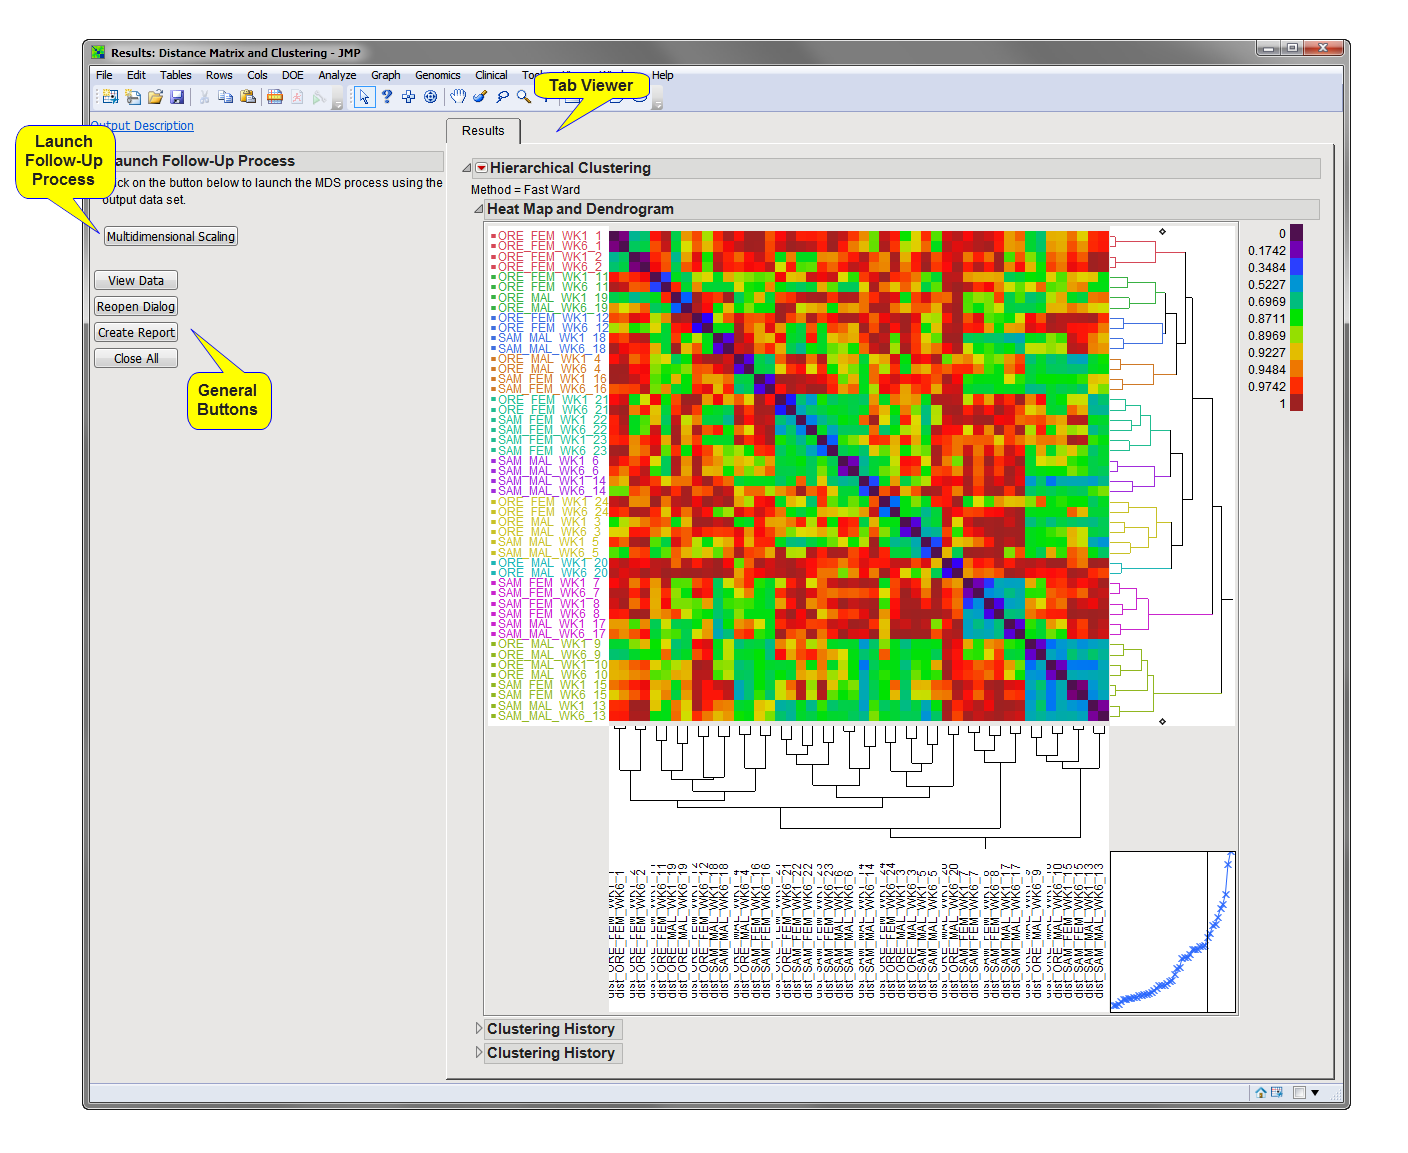
The
Results
window contains the following panes:
This pane provides you with a space to view individual tabs within the
Results
window. Use the tabs to access and view the output plots and associated data sets.
|
•
|
The output data used to generate this heat map consists of the copied
variables
and the proximity measures in a square matrix.
|
•
|
Multidimensional Scaling
: Click
to launch the
Multidimensional Scaling
process with the output distance matrix data set used here is the preloaded in as input.
|
|
•
|
Click
to reveal the underlying data table associated with the current tab.
|
|
•
|
Click
to reopen the completed process dialog used to generate this output.
|
|
•
|
Click
to generate a
pdf
- or
rtf
-formatted report containing the plots and charts of selected tabs.
|
|
•
|
Click
to close all graphics windows and underlying data sets associated with the output.
|