A useful method for describing the variations in patterns of LD across large
DNA
regions involves calculating the metric
linkage disequilibrium
units
(LDUs) between pairs of
SNPs
(Maniatis
et al.
, 2002). The LDU scale, which has additive distances and locations monotonic with physical and genetic maps (Zang, W.
et al
. 2002), provides a coordinate system whose scale is proportional to the regional differences in the strength of LD, in a fashion analogous to the recombination maps constructed in cM used to guide
linkage
studies (Kong, A.,
et al
., 2002). A pattern of
plateaus
, which correspond to regions of high LD, and
steps
, which correspond to regions of increased recombination (Zang, W.
et al
. 2002), is evident.
The
Malecot LD Map
process uses an estimate of the LD measure
Rho
(calculated using the
Linkage Disequilibrium
process and included in the output data set ending with
_ldstats
that it creates) to fit the Malecot model
Rho = (1-L)*M*exp(-E_i*d_i)+L
to each interval of length
d_i
kb between consecutive SNPs via nonlinear optimization routines. Distances between pairs of SNPs can then be represented in terms of
LD units
(LDU), which are computed by summing (
E_i*d_i
) over all intervals between the pair of SNPs. The distance in terms of LDU is plotted versus the
physical distance
between consecutive SNP pairs in the plot(s). For reference, see Maniatis
et al
. (2002).This Analytical Procedure uses
SAS PROC NLMIXED
to fit the Malecot model by weighted nonlinear least squares.
Before running the
Malecot LD Map
process, an intermediate data set must be created using either the
Linkage Disequilibrium
process or another program that creates a data set containing
variables
with the following information for each pair of genetic markers (for example, SNPs):
|
3
|
The
samplegmdata
data set used in the following example was computer generated and consists of 1000 rows of individuals with 130 columns corresponding to data on these individuals. This is a wide data set; markers are listed in columns, whereas individuals are listed in rows. The
samplegmdata
data set is included in the
Sample Data
folder that comes with JMP Genomics and is
described in
Data Sets Used in JMP Genomics Processes
.
The intermediate
samplegmdata.ldstats
data set was generated using the
Linkage Disequilibrium
process. The data set has 16 columns and 930 rows. The
Estimate Rho and K_Rho
box found on the
Options
tab of the
Linkage Disequilibrium
dialog
was checked. This
samplegmdata.ldstats
data set, illustrated below, was saved in the
ProcessResults
folder.
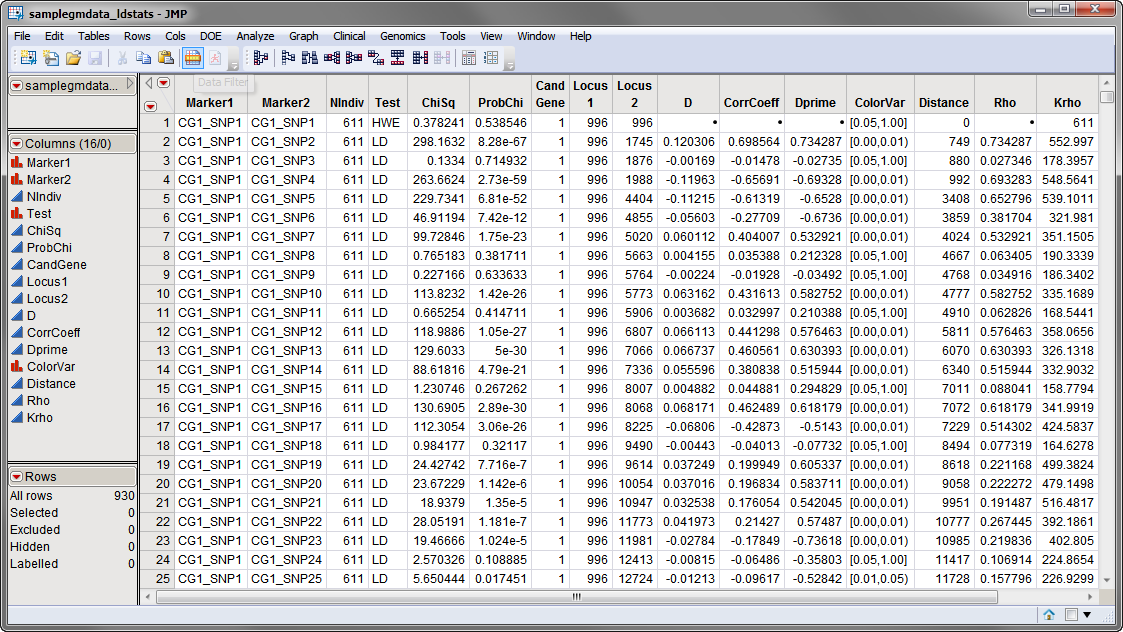
The
samplegmdata_ldstats.sas7bdat
data set contains the elements needed for successful use of the
Malecot LD Map
process. The labels for each pair of SNPs are contained in the
Marker1
and
Marker2
columns. The location for each of the SNPs is given in the
Locus1
and
Locus2
columns. Finally, the values for
Rho
and
K_Rho
are given in the
Rho
and
Krho
columns.
For detailed information about the files and data sets used or created by JMP Life Sciences software, see
Files and Data Sets
.
The output generated by this process is summarized in a Tabbed report. Refer to the
Malecot LD Map
output documentation for detailed descriptions and guides to interpreting your results.