This process tests for
association
of a
trait
or disease with rare variants, and optionally common variants, that occur in the same gene or pathway.
The options provided in this process are designed to accommodate several
models
for analyzing rare variants, aligning with the unified framework for rare variant tests described in Hoffmann, Marini, and Witte (2010). Some of the methods that can be implemented include: the weighted sum method described by Madsen and Browning (2009); a variable-threshold approach (Price
et al
. 2010) with or without weights such as PolyPhen-2 scores; models taking the direction of the variant's effect into account, similar to Han and Pan's data-adaptive sum model (2010); as well as combinations of these approaches. Three other approaches outside of this framework are available for
binary traits
: the KBAC (Liu and Leal 2010), the CMAT (Zawistowski
et al.
2010), and the C-
allele
test (Neale
et al
. 2011).
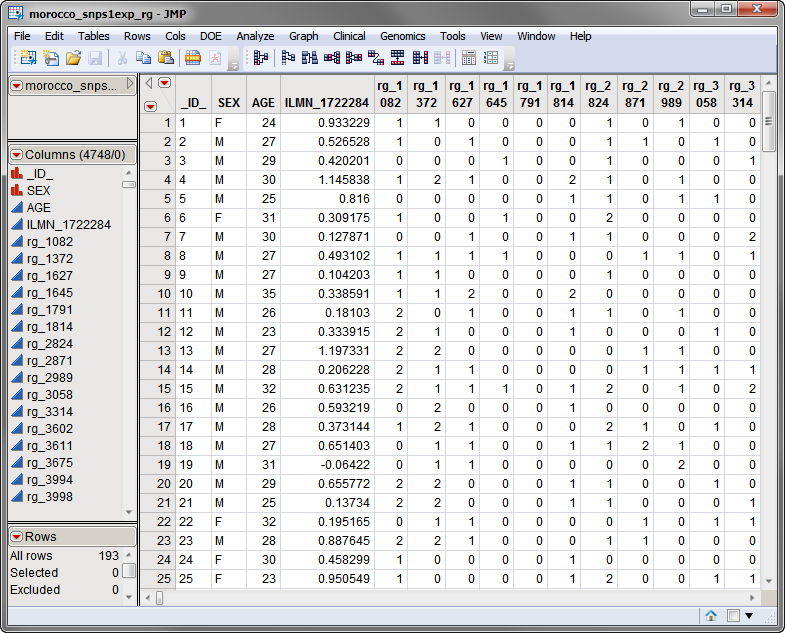
Two data sets are needed for this process. The first required data set, the
Input Data Set
, contains all of the marker data. The sample data set used in the following example, the
morocco_snps1exp_rg.sas7bdat
data set, represents the data from a study of gene
expression
variation and
SNP
associations in southern Morocco (Idaghdour, Czika,
et al
., 2010) that has been recoded to numeric
genotypes
using the
Recode Genotypes
process.
Note
: The data was modified slightly to preserve anonymity of subjects.
The
morocco_snps1exp_rg.sas7bdat
data set lists genotype data at 4744 SNPs in 193 individuals. Marker data is presented in the one-column format. This data set is partially shown below. Note that this is a wide data set; markers are listed in columns, whereas individuals are listed in rows.
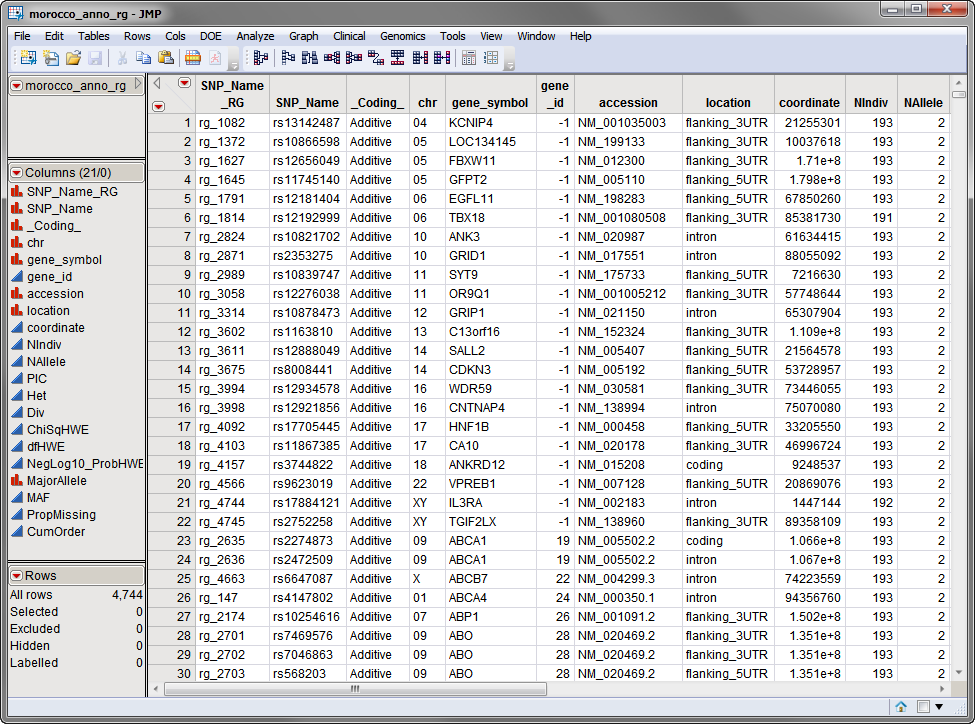
The second required data set is the
Annotation Data Set
. This data set contains information, such as gene identity or chromosomal location, for each of the markers. The
morocco_anno_rg.sas7bdat
annotation data set
is used in this example. A portion of this data set is illustrated below. This data set is a tall data set; each row corresponds to a different marker.
Note
: The top-to-bottom order of the rows in the annotation data set matches the left-to-right order of the columns in the input data set. This correspondence is required for markers to be matched appropriately.
Both data sets are included in the
Sample Data
folder that comes with JMP Genomics.
For detailed information about the files and data sets used or created by JMP Life Sciences software, see
Files and Data Sets
.
The output generated by this process is summarized in a Tabbed report. Refer to the
Rare Variant Association
output documentation for detailed descriptions and guides to interpreting your results.