Instead of examining markers individually, it can often be more informative to look at a set of
alleles
and markers from the same
chromosome
as a single entity, that is, as a
haplotype
. However, when
genotype
data are collected, the two haplotypes that compose a multilocus genotype are not typically observed. Thus, the alleles, passed together from one parent, for each of the set of markers, remain unknown.
The first step in any haplotype analysis is typically to estimate the unobserved haplotype frequencies, which, in JMP Genomics, is done using the
Haplotype Estimation
process. This process invokes an expectation-maximization (EM) algorithm to estimate haplotype frequencies, either for one particular set of markers, or for many sets.
Estimates of haplotype frequencies can be used in a variety of ways: to test for multilocus
linkage disequilibrium
, to test for
association
between a
trait
and several markers at once, and to infer the parental haplotypes that an individual receives. Output data sets from the
Haplotype Estimation
process are used as input for the
Haplotype Trend Regression
process, in order to further determine the particular haplotype from a set of markers that might be influencing a trait (binary, quantitative, count, or survival). Output data sets can also feed the
htSNP Selection
process to determine the subset(s) of markers that explain much of the haplotype diversity within a block of strongly associated markers.
One
Input Data Set
is needed for this process. The
samplegmdata.sas7bdat
data set used in the following example was computer generated and consists of 1000 rows of individuals with 130 columns corresponding to data on these individuals. There are 2 categorical phenotypic
variables
(
sex
and
disease
status) and 4 quantitative phenotypic variables (
Qtrt1
,
Qtrt2
,
Qtrt3
, and
Qtrt4
). Genotypes for 60 different markers are presented in the two-column
allelic
format (
ma1
—
ma120
). This data set is partially shown below.
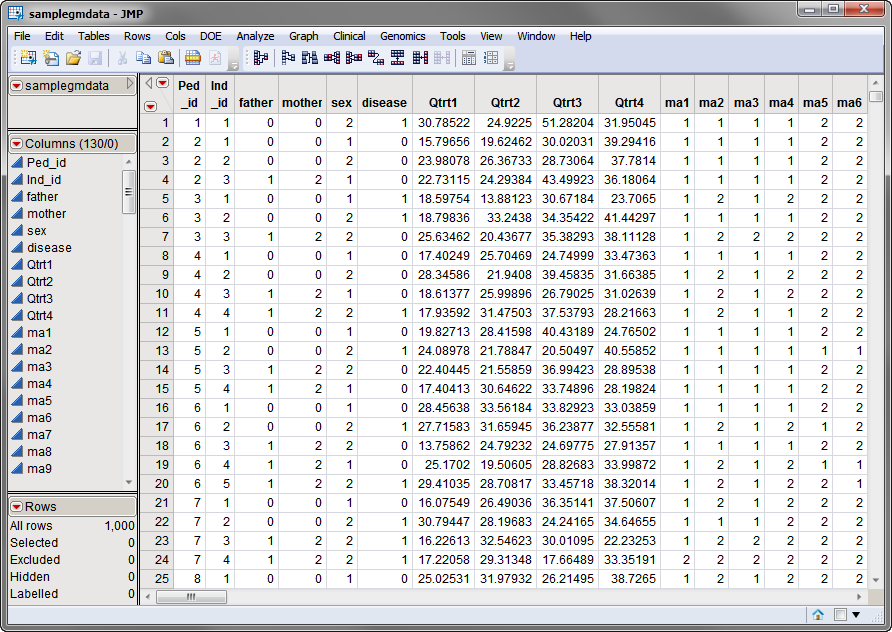
Note that this is a wide data set;
phenotypes
and markers are listed in columns, whereas individuals are listed in rows.
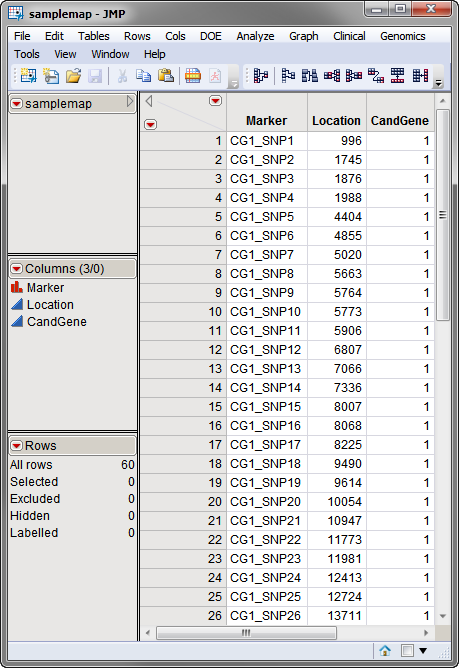
The second, optional, data set is the
Annotation Data Set
. This data set contains information, such as gene identity or chromosomal location, for each of the markers. The
annotation data set
used in this example, the
samplemap
data set, was computer generated and identifies markers, location and gene identities. A portion of this data set is illustrated below. This data set is a tall data set; each row corresponds to a different marker.
Note
: The top-to-bottom order of the rows in the annotation data set matches the left-to-right order of the columns in the input data set. This correspondence is required for markers to be matched appropriately.
Both data sets are
described in
Data Sets Used in JMP Genomics Processes
and
are included in the
Sample Data
folder.
For detailed information about the files and data sets used or created by JMP Life Sciences software, see
Files and Data Sets
.
The output generated by this process is summarized in a Tabbed report. Refer to the
Haplotype Estimation
output documentation for detailed descriptions and guides to interpreting your results.