The
QTL Single Marker Analysis
process
provides you with a way to quickly scan the whole
genome
for evidence of
QTL
signals. It performs a simple
regression
for each marker with
trait
values and computes the probability of QTL evidence for each marker.
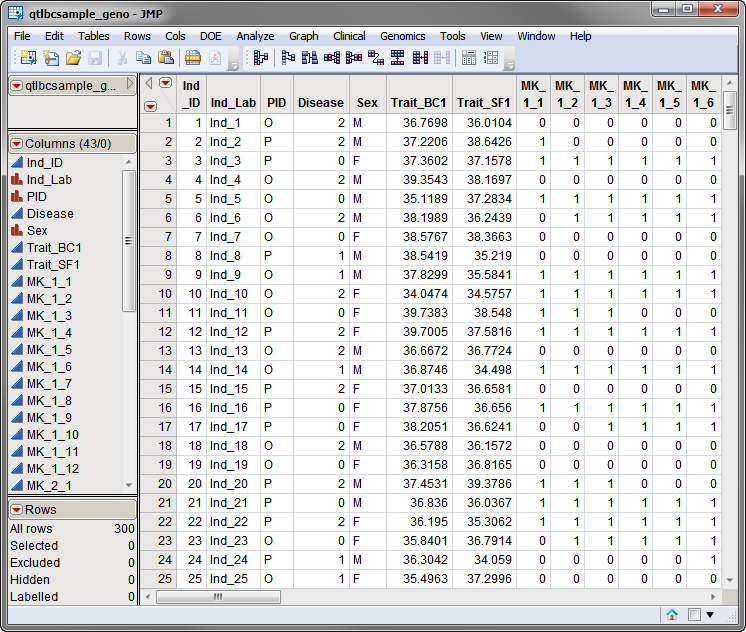
Two SAS data sets are required. The first, the
input cross file, lists information about the different genetic crosses used in the study. The
qtlbcsample_geno.sas7bdat
data set, used in the following example, is shown below. This is a wide data set with 300 individuals listed in rows, and the status of individuals for two traits and 36 markers, spanning 3
chromosomes
, listed in columns. Markers are formatted as numeric
genotypes
.
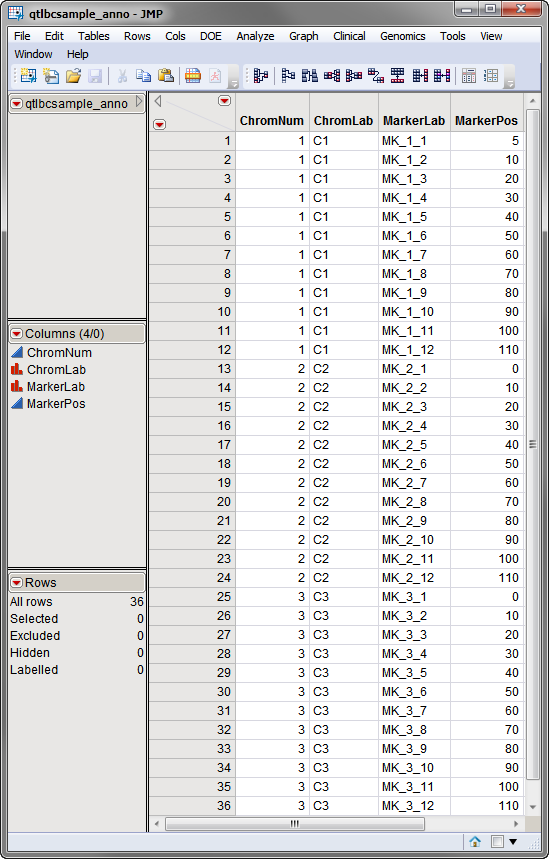
The second required data set is an
Annotation Data Set
, that
lists map information for each of the markers.
The
qtlbcsample_anno.sas7bdat
annotation data set
, used in the following example, is shown below. This data set contains 4 columns listing the name and position (in cM) of 36 QTL markers present on three chromosomes.
Both the
qtlbcsample_geno.sas7bdat
and the
qtlbcsample_anno.sas7bdat
data sets are located in the
Sample Data\QtlMapping
directory included with JMP Genomics.
For detailed information about the files and data sets used or created by JMP Life Sciences software, see
Files and Data Sets
.
The output generated by this process is summarized in a Tabbed report. Refer to the
QTL Single Marker Analysis
output documentation for detailed descriptions and guides to interpreting your results.
More detailed analyses, such as
Interval Mapping
or Multiple-Interval Mapping, can be done to further delimit the region of significance.